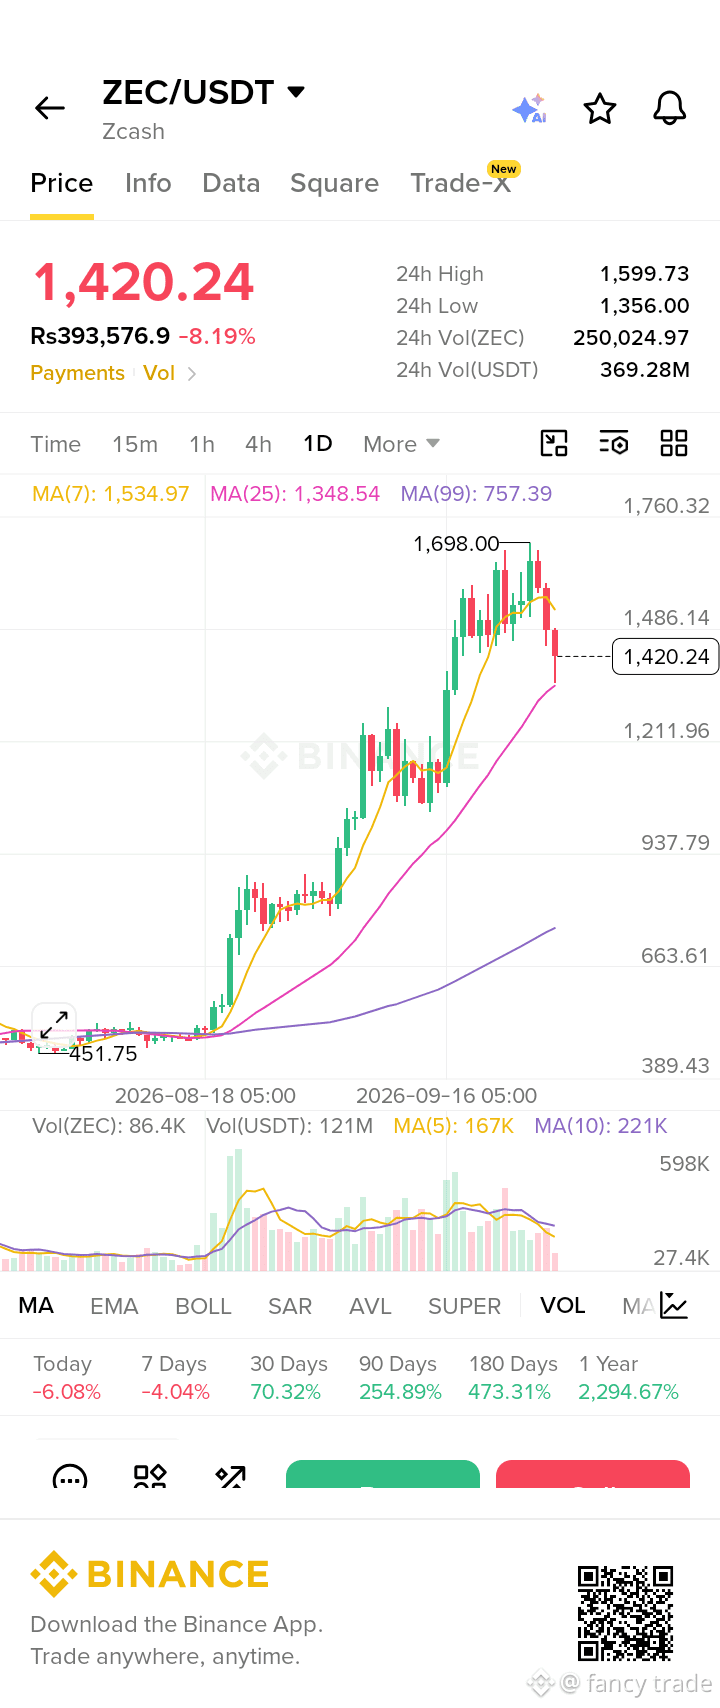
$ZEC /USDT — 1D Chart Analysis
Current price: ~$1,421
24h change: -8.13%
24h high/low: $1,599 / $1,356
🟡 Strong long-term uptrend, short-term correction
Price is below MA(7) $1,535, showing short-term weakness.
Price is still above MA(25) $1,348, so the medium-term structure remains bullish.
Major resistance: $1,486 → $1,535 → $1,600 → $1,698
Major support: $1,356–$1,348 → $1,212
The recent rejection from around $1,698 followed by several red candles suggests profit-taking/correction.
A daily close back above $1,535 would improve the short-term structure.
A daily break below $1,348 could increase downside pressure toward roughly $1,212.
Possible scenarios
Bullish:
$1,348 holds → price recovers $1,486 → $1,535 → potentially retests $1,600–$1,698.
Bearish:
$1,348 breaks decisively → next important area around $1,212.
Key level right now: ~$1,350. The reaction there is important for determining whether this is just a pullback or a deeper correction.#OpenAIDelaysGPT6.1OverSafetyIssues #UKFCAWinsCourtOrderToRecover851400Pounds
Current price: ~$1,421
24h change: -8.13%
24h high/low: $1,599 / $1,356
🟡 Strong long-term uptrend, short-term correction
Price is below MA(7) $1,535, showing short-term weakness.
Price is still above MA(25) $1,348, so the medium-term structure remains bullish.
Major resistance: $1,486 → $1,535 → $1,600 → $1,698
Major support: $1,356–$1,348 → $1,212
The recent rejection from around $1,698 followed by several red candles suggests profit-taking/correction.
A daily close back above $1,535 would improve the short-term structure.
A daily break below $1,348 could increase downside pressure toward roughly $1,212.
Possible scenarios
Bullish:
$1,348 holds → price recovers $1,486 → $1,535 → potentially retests $1,600–$1,698.
Bearish:
$1,348 breaks decisively → next important area around $1,212.
Key level right now: ~$1,350. The reaction there is important for determining whether this is just a pullback or a deeper correction.#OpenAIDelaysGPT6.1OverSafetyIssues #UKFCAWinsCourtOrderToRecover851400Pounds