
$BTC Next Plan
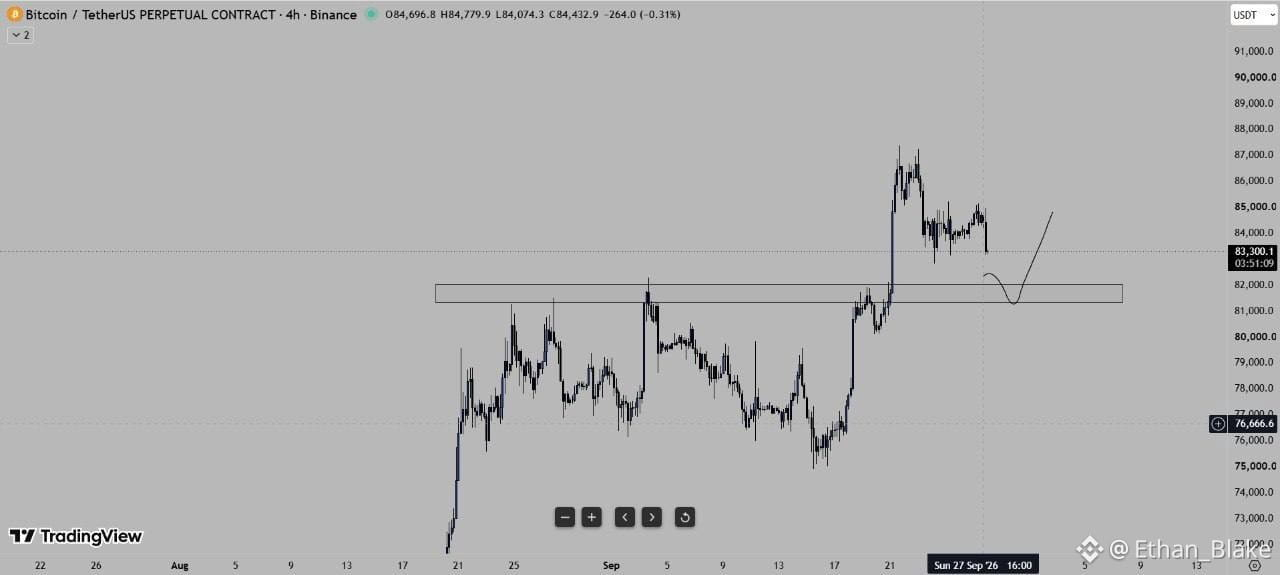
From your 4H chart, the key area is the marked $81.3K–$82.2K demand/retest zone.
Current area: ~$83.1K–$83.5K.
Key support: $81.3K–$82.2K — previous breakout area.
If BTC holds that zone: the chart structure points toward a retest of $84.5K–$85K, followed by the recent $86K–$87K region.
If the zone breaks decisively: the bullish 4H structure weakens, and the next downside areas become important rather than assuming an immediate recovery.
Your drawn setup specifically suggests a pullback into the $81K–$82K zone → reaction → continuation higher. Binance Research also notes that BTC recently pulled back below $84K after trading above $86K, while continued demand and holding key trend levels are important for confirming the recovery structure.
Simple invalidation idea: don't treat a wick below the zone as enough by itself; watch how the 4H candle closes and whether price can reclaim the zone.
This is a chart-based scenario, not a guaranteed move.$BTC
From your 4H chart, the key area is the marked $81.3K–$82.2K demand/retest zone.
Current area: ~$83.1K–$83.5K.
Key support: $81.3K–$82.2K — previous breakout area.
If BTC holds that zone: the chart structure points toward a retest of $84.5K–$85K, followed by the recent $86K–$87K region.
If the zone breaks decisively: the bullish 4H structure weakens, and the next downside areas become important rather than assuming an immediate recovery.
Your drawn setup specifically suggests a pullback into the $81K–$82K zone → reaction → continuation higher. Binance Research also notes that BTC recently pulled back below $84K after trading above $86K, while continued demand and holding key trend levels are important for confirming the recovery structure.
Simple invalidation idea: don't treat a wick below the zone as enough by itself; watch how the 4H candle closes and whether price can reclaim the zone.
This is a chart-based scenario, not a guaranteed move.$BTC