


Stacks (STX) Decline Explained: Macro Shock and Technical Positioning
The 3.23 percentage point move in Stacks (STX) over the last ~14 hours appears driven by a broad, macro-induced crypto selloff rather than any STX-specific news.
Macro Shock and Market-Wide Selloff
Over roughly the last day, the entire crypto market has been in a mild risk-off phase. Total crypto market cap is down about 1.45% over 24 hours, with altcoins down about 1.77%.¹
Several macro and BTC specific factors line up with the timing of STX’s move:
Bitcoin dropped from a failed push above about $85,000 to below $83,000 on September 28, linked by multiple reports to US President Donald Trump rejecting Iran’s peace proposal and renewed concerns about oil prices, yields, and Fed policy.¹
Coverage of the day’s moves explicitly describes a “broad altcoin crash,” with the total crypto market cap losing roughly $70 billion and STX included among notable decliners in that environment.²
Market-wide derivatives data shows large liquidations (over 100k positions closed in 24 hours) and a deleveraging tone, which tends to hit mid-cap altcoins like STX harder than BTC.³
On the STX price series itself, over the last 24 hours it drifted from about $0.335 at 01:00 UTC on 28 Sep to about $0.312 at 21:00 UTC, with small intraday bounces but no isolated crash. That pattern matches a steady bleed in a weak market rather than a one-off protocol shock.
The main identifiable catalyst is the macro risk-off move that knocked BTC off resistance and dragged the entire altcoin complex lower, with STX participating as part of that broader repricing.
Prior Outperformance and Technical Positioning in STX
STX did not start this move from a flat base. It had recently been a relative winner:
A widely circulated technical post on X highlighted that over the prior 7 days STX had gained more than 21.5%, outpacing a “largely flat altcoin market,” with the daily RSI near 68, which is close to overbought territory.²
That same analysis framed STX as in a “technical breakout structure” with key resistance around $0.353 and strong support zones lower. Once macro conditions turned, stretched charts like this often see sharper pullbacks as traders lock in gains.
On CoinMarketCap data, Stacks is down about 8.98% over 24 hours and about 10.08% over 7 days, which indicates that much of the recent run has already been retraced, consistent with profit-taking into weakness rather than a new fundamental problem.
Intraday trader commentary also fits a “positioning plus volatility” story rather than a news-driven dump:
Multiple X accounts discuss STX purely in chart terms, for example a descending channel with upside targets if it breaks out, or “triple inside day on declining volume” with a technical level to watch.⁴
Other traders report being stopped out and then re-entering after “textbook action allowing the 20 EMA to catch up,” again treating the move as normal volatility around moving averages rather than reaction to a headline.⁵
STX had run ahead of the market, so when macro risk hit and BTC rolled over, it was a natural candidate for sharper mean reversion. That helps explain why it is down more than the aggregate altcoin market over the period.
No STX-Specific Negative Catalyst in the Last Day
To check for idiosyncratic drivers, it is important to look for:
Protocol issues such as hacks, consensus failures, or critical bugs.
Listing or delisting news from major exchanges.
Tokenomics surprises like large unlocks, governance votes, or foundation sales.
Across official and news sources in the past week:
Recent narrative threads about the Stacks ecosystem are positive. They focus on Bitcoin Layer 2 momentum, the launch of a 90-day Stacks DeFi incentive program distributing 1 BTC per month to DeFi users, and PoX-based “Bitcoin bonds” that pair BTC with STX collateral.²
Weekly ecosystem briefings highlight self-custodial Bitcoin staking on Stacks, sub-second block times, and new DeFi activity, again treating fundamentals as improving rather than deteriorating.⁶
Searches of recent project posts and crypto news do not reveal any reports of exploits, regulatory actions, delistings, or emergency governance proposals related to Stacks in this timeframe.
General market roundups that list STX among “losers” for the day do so in the context of a broad altcoin selloff. They do not attach a unique negative headline or controversy to STX itself.⁷
Given this, there is no evidence that the 3.23 percentage point intraday move came from a discrete, Stacks-specific catalyst such as a hack or project announcement.
The available data point to STX moving as a leveraged, recently extended altcoin inside a macro-driven market unwind, not as a token reacting to its own negative news.
Conclusion
The best supported explanation is that Stacks’ 3.23 percentage point move over the past ~14 hours is an expression of broader risk-off conditions in crypto that began when BTC was rejected near $85,000 amid geopolitical tensions, combined with STX’s own prior outperformance and technically stretched setup.
No clear, project-specific negative catalyst, exploit, or listing event for Stacks appears in the last day, so the move looks like amplified beta to a macro shock rather than a direct reaction to Stacks news.
Confidence: Medium, because the macro and technical context are well documented but there is always a chance of minor, under-reported project events that did not surface in main news or official channels.
As of 28 Sep 2026 9:58pm UTC using CMC live price, CMC historical price, CMC market overview, news articles, and posts from X.
CMC AI can make mistakes. Please DYOR.
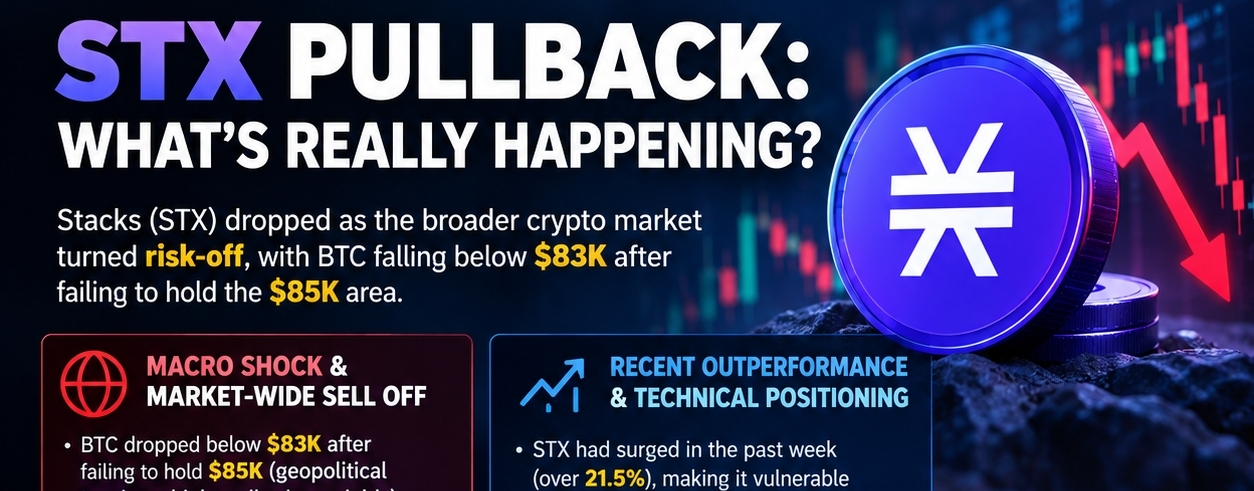
🚨 STX PULLBACK: WHAT’S REALLY HAPPENING?
Stacks (STX) fell as the broader crypto market turned risk-off, with BTC dropping below $83K after failing to hold the $85K area.
📉 $STX had recently rallied strongly, making profit-taking and leveraged unwinding more likely when the market reversed.
🔎 No major hack, exploit, delisting, or Stacks-specific negative catalyst has been identified. The move appears largely driven by macro pressure + market-wide deleveraging + STX’s recent overextension.
Key levels traders are watching: ~$0.353 resistance and lower support zones.
DYOR — crypto remains highly volatile.