
🚨 $BTW TECHNICAL ANALYSIS Parabolic Rally, Breakout Retest Failed 🩸
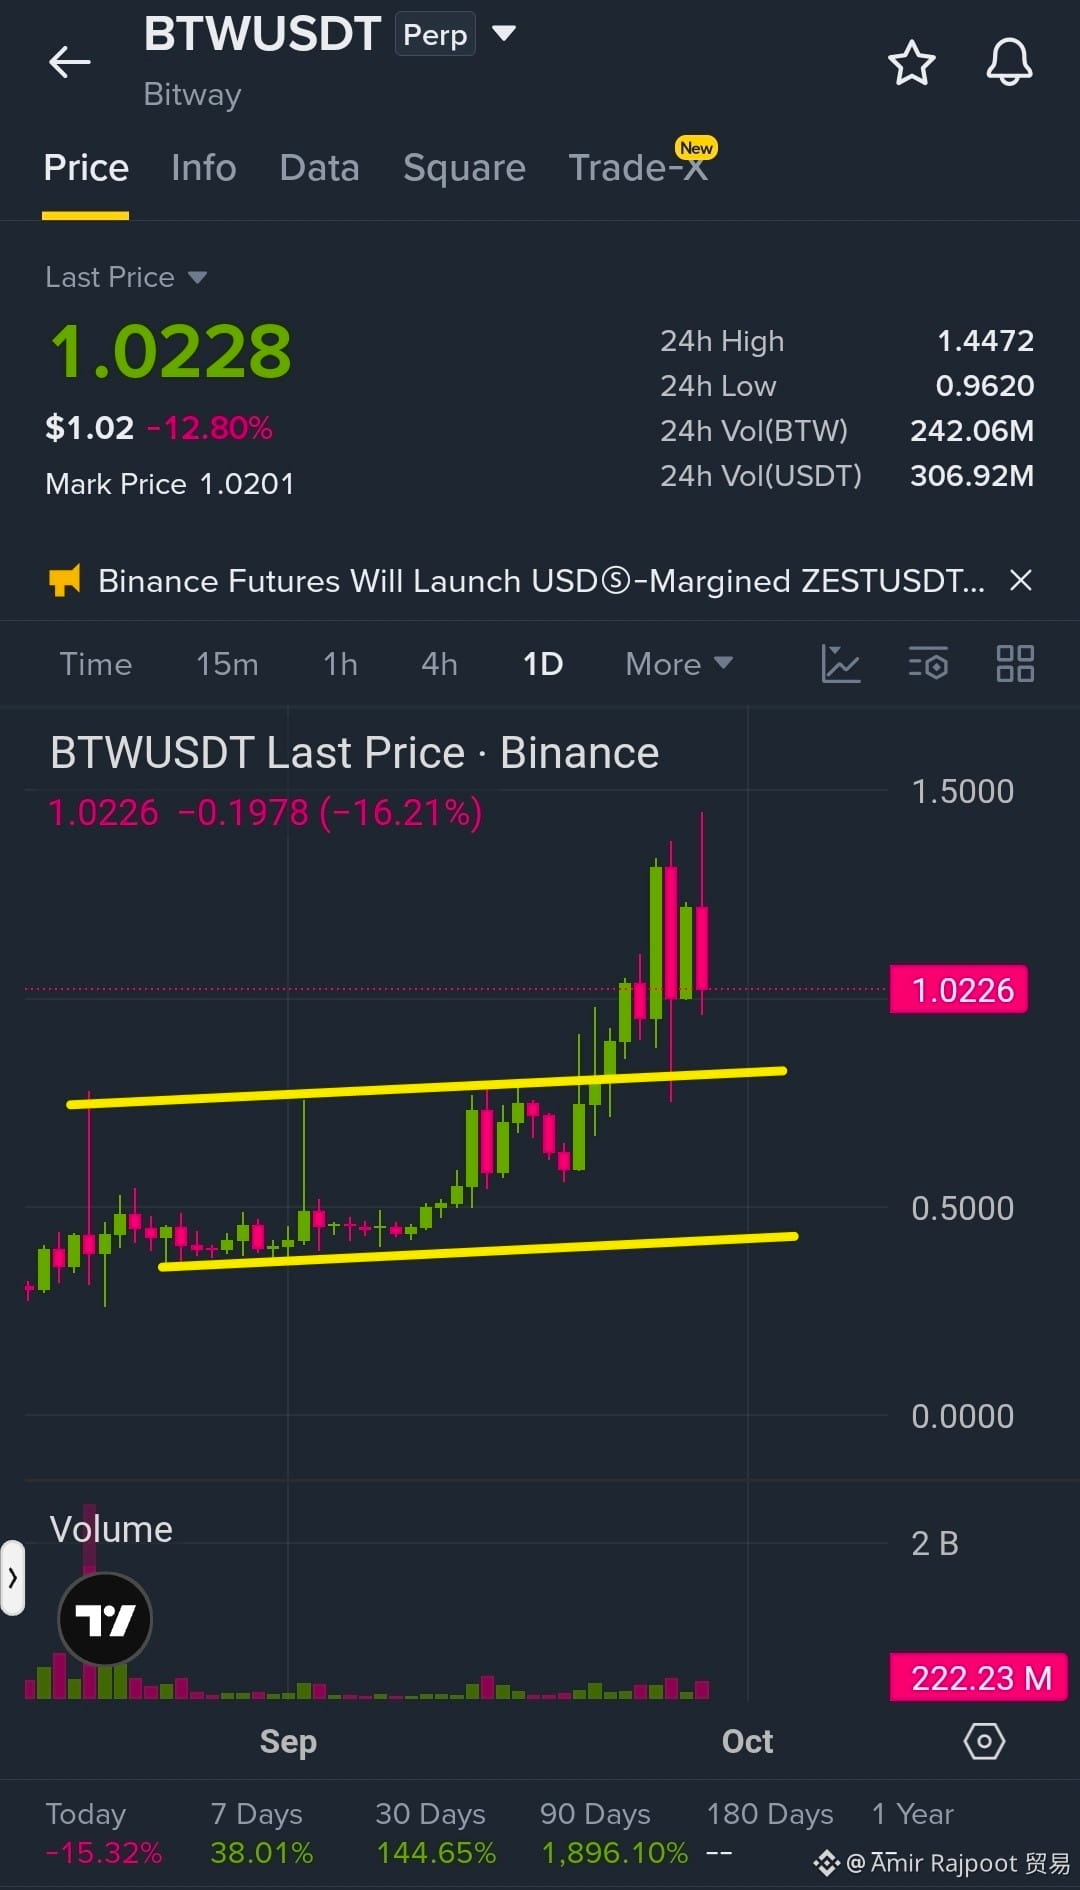
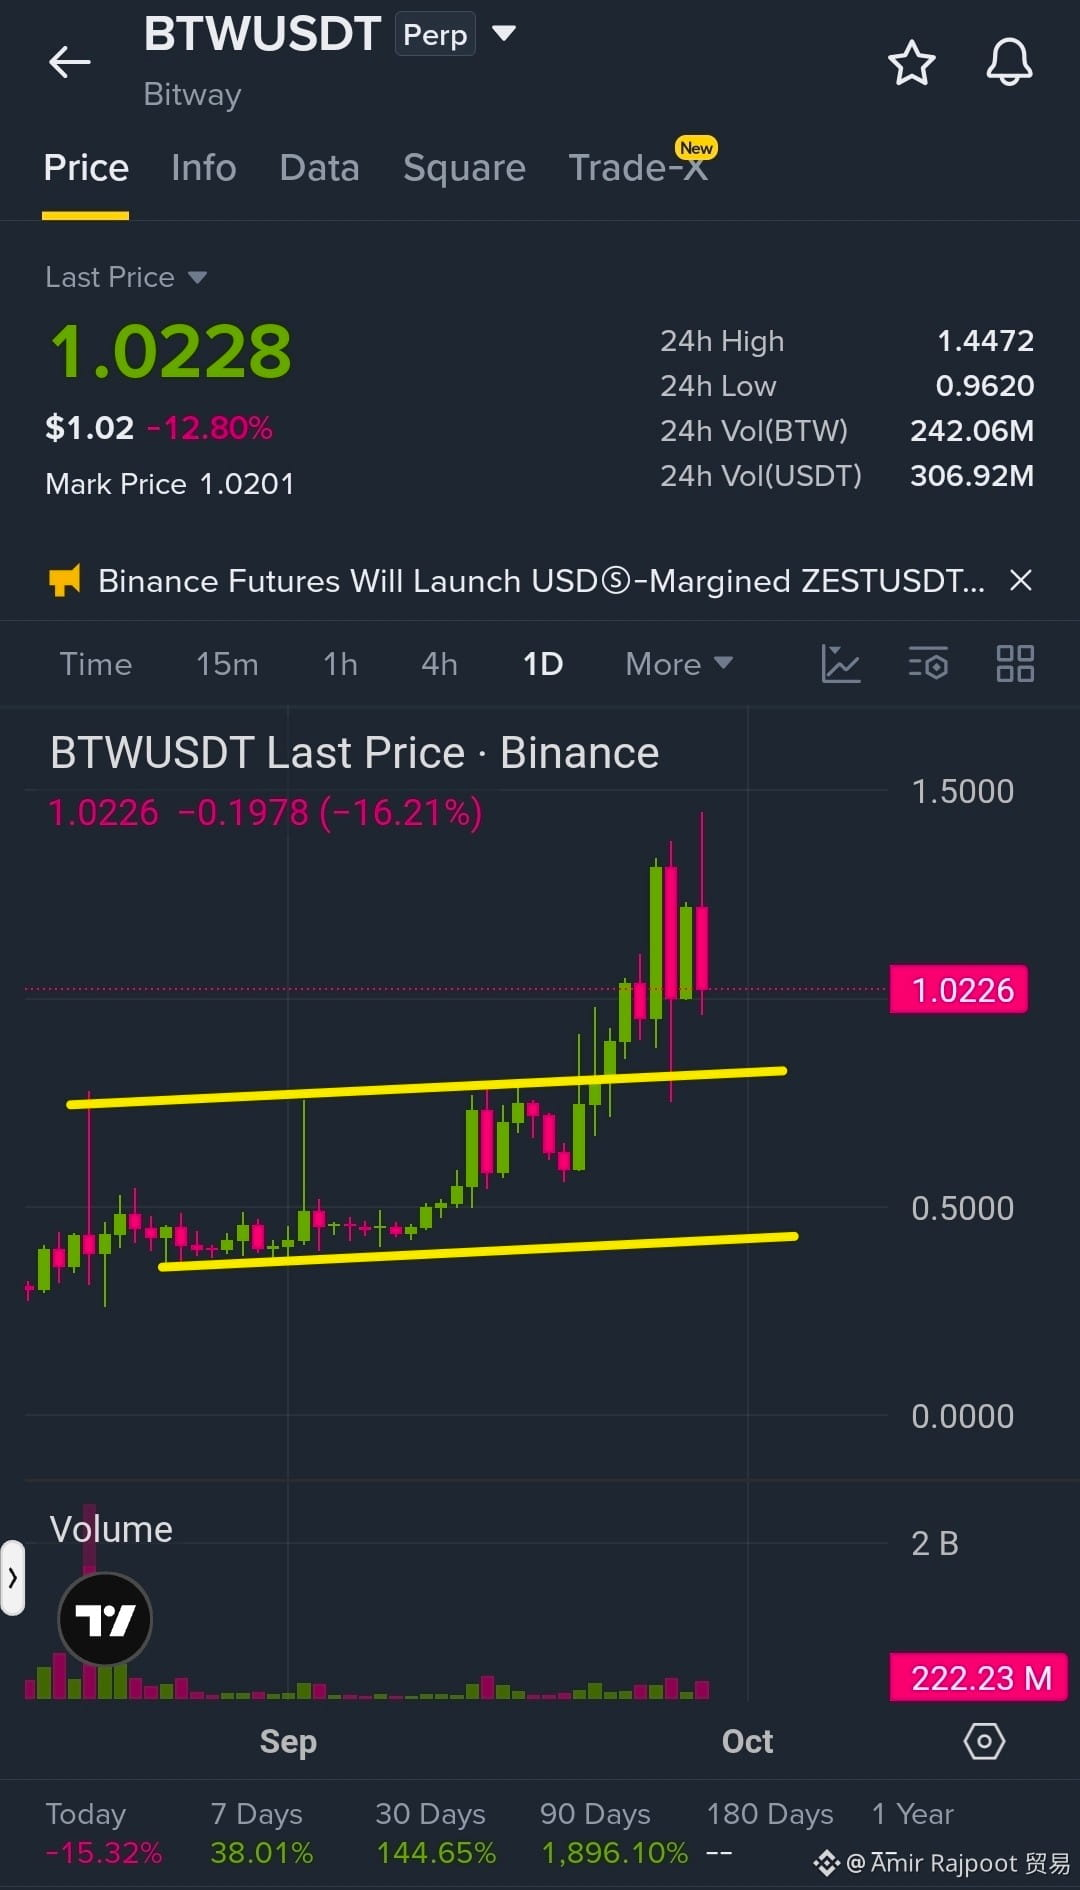
$BTW exploded from the $0.40 region toward $1.44, followed by a sharp rejection and pullback to around $1.028. The 1D chart shows a major breakout from its ascending channel, but volatility is increasing. Bulls need to defend the $0.95–1.00 zone to keep the bullish structure alive.
🔴 Resistance Zones: (sell/short) • $1.10–1.15 • $1.25–1.30 • $1.40–1.45
🟢 Support Zones: (buy/long) • $0.95–1.00 • $0.80–0.85 • $0.60–0.65 • $0.45–0.50
A rejection from $1.10–1.15 could bring BTW back toward $1.00 support. A sustained breakout above $1.15 could open the door toward $1.25–1.30 and potentially retest the $1.44 high. Losing $0.95 would weaken the bullish setup and increase the risk of a deeper correction.
$BTW exploded from the $0.40 region toward $1.44, followed by a sharp rejection and pullback to around $1.028. The 1D chart shows a major breakout from its ascending channel, but volatility is increasing. Bulls need to defend the $0.95–1.00 zone to keep the bullish structure alive.
🔴 Resistance Zones: (sell/short) • $1.10–1.15 • $1.25–1.30 • $1.40–1.45
🟢 Support Zones: (buy/long) • $0.95–1.00 • $0.80–0.85 • $0.60–0.65 • $0.45–0.50
A rejection from $1.10–1.15 could bring BTW back toward $1.00 support. A sustained breakout above $1.15 could open the door toward $1.25–1.30 and potentially retest the $1.44 high. Losing $0.95 would weaken the bullish setup and increase the risk of a deeper correction.