🧨 DEBIT HOLDS THE 1.80 ZONE — A RECOVERY SETUP IS FORMING
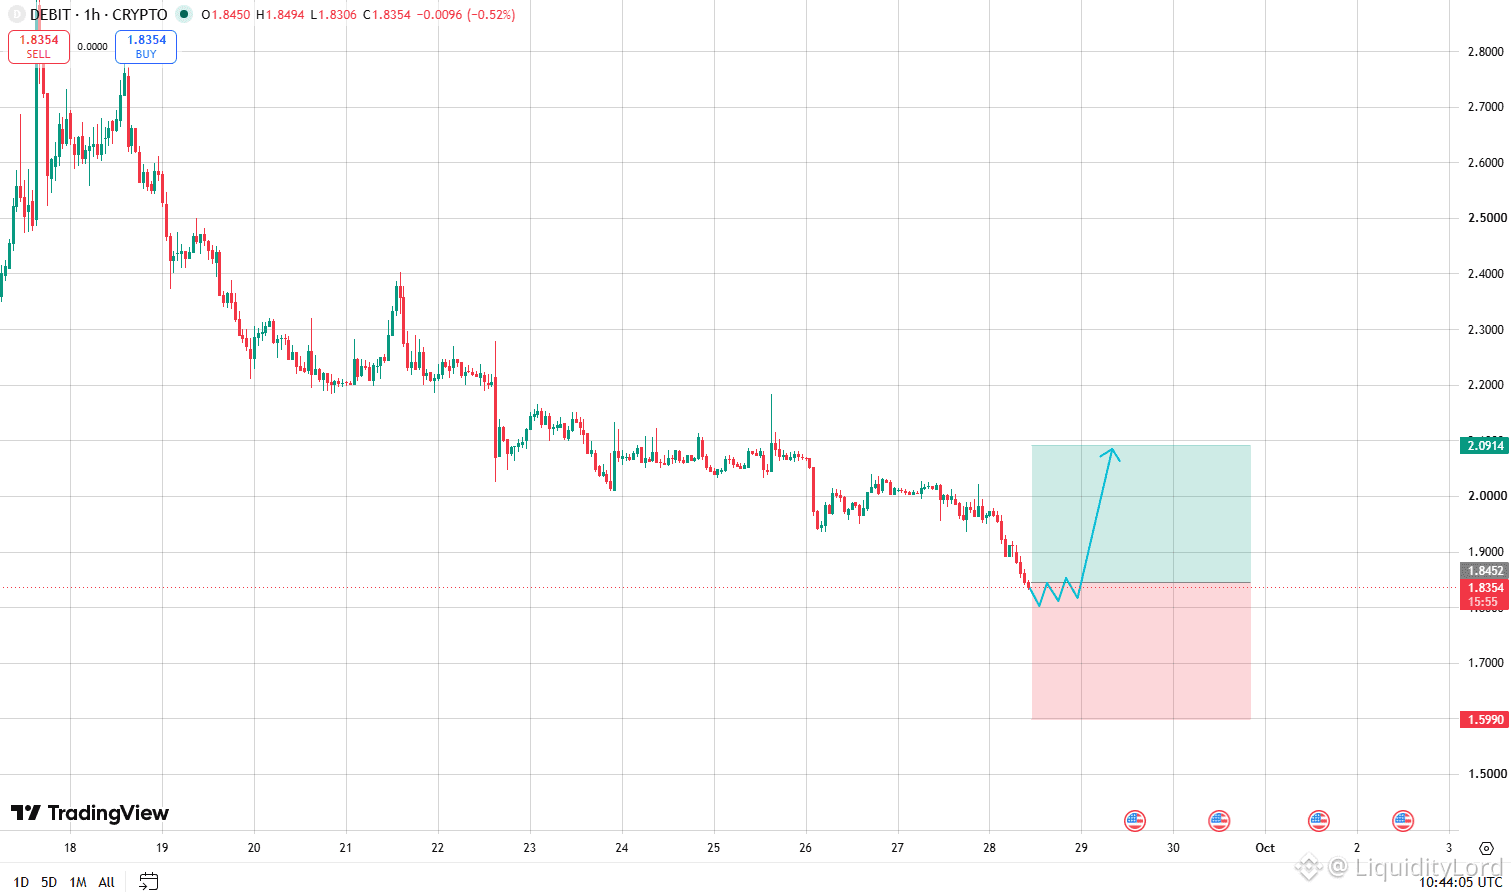
DEBIT/USDT on the 1H chart has spent several sessions in a broad decline, falling from the 2.80 area toward 1.80. The latest candles are stabilizing close to 1.83, with the chart marking a potential reaction zone before a move toward 2.09.
📉 THE MARKET IS TRYING TO BUILD A BASE
Recent action is moving sideways after the sharp decline, creating a potential base, but confirmation is still needed before continuation on the chart.
The key area is 1.80–1.84. Holding this zone keeps the recovery scenario active. A clean breakdown below support would invalidate the setup and shift attention toward 1.60.
🎯 TRADE PARAMETERS
Entry: 1.82–1.86
Invalidation: 1.80
TP1: 1.90
TP2: 2.00
TP3: 2.09
Stop Loss: 1.59
TP1 is the first reaction level after a bounce. TP2 returns price toward the previous consolidation area, while TP3 matches the upper target marked on the chart.
🧭 WHAT NEEDS TO HAPPEN NEXT
The cleaner scenario is a hold above 1.80 followed by higher lows on the 1H chart. A push through 1.90 would show buyers gaining control of the short-term range. Above 2.00, the 2.09 target becomes the next important reference.
If price breaks 1.80 and cannot reclaim it, the recovery idea should be reconsidered.
⚙ LIQUIDITY DURING THE ROTATION
A move from a compressed range can become messy when traders enter at the same time. ST0Nfi can fit into this process by comparing available liquidity routes and quotes before a swap is executed.
For DEBIT, the levels are clear: 1.80 is the base, 1.90 is the first recovery checkpoint, 2.00 is the next resistance area, and 2.09 is the marked upside objective. The reaction around 1.80 should define the next short-term direction.
NFA - DYOR
$DEBIT
DEBIT/USDT on the 1H chart has spent several sessions in a broad decline, falling from the 2.80 area toward 1.80. The latest candles are stabilizing close to 1.83, with the chart marking a potential reaction zone before a move toward 2.09.
📉 THE MARKET IS TRYING TO BUILD A BASE
Recent action is moving sideways after the sharp decline, creating a potential base, but confirmation is still needed before continuation on the chart.
The key area is 1.80–1.84. Holding this zone keeps the recovery scenario active. A clean breakdown below support would invalidate the setup and shift attention toward 1.60.
🎯 TRADE PARAMETERS
Entry: 1.82–1.86
Invalidation: 1.80
TP1: 1.90
TP2: 2.00
TP3: 2.09
Stop Loss: 1.59
TP1 is the first reaction level after a bounce. TP2 returns price toward the previous consolidation area, while TP3 matches the upper target marked on the chart.
🧭 WHAT NEEDS TO HAPPEN NEXT
The cleaner scenario is a hold above 1.80 followed by higher lows on the 1H chart. A push through 1.90 would show buyers gaining control of the short-term range. Above 2.00, the 2.09 target becomes the next important reference.
If price breaks 1.80 and cannot reclaim it, the recovery idea should be reconsidered.
⚙ LIQUIDITY DURING THE ROTATION
A move from a compressed range can become messy when traders enter at the same time. ST0Nfi can fit into this process by comparing available liquidity routes and quotes before a swap is executed.
For DEBIT, the levels are clear: 1.80 is the base, 1.90 is the first recovery checkpoint, 2.00 is the next resistance area, and 2.09 is the marked upside objective. The reaction around 1.80 should define the next short-term direction.
NFA - DYOR
$DEBIT