🧨 PUMP BREAKS THE DESCENDING CHANNEL — 0.00400 IS THE KEY LEVEL
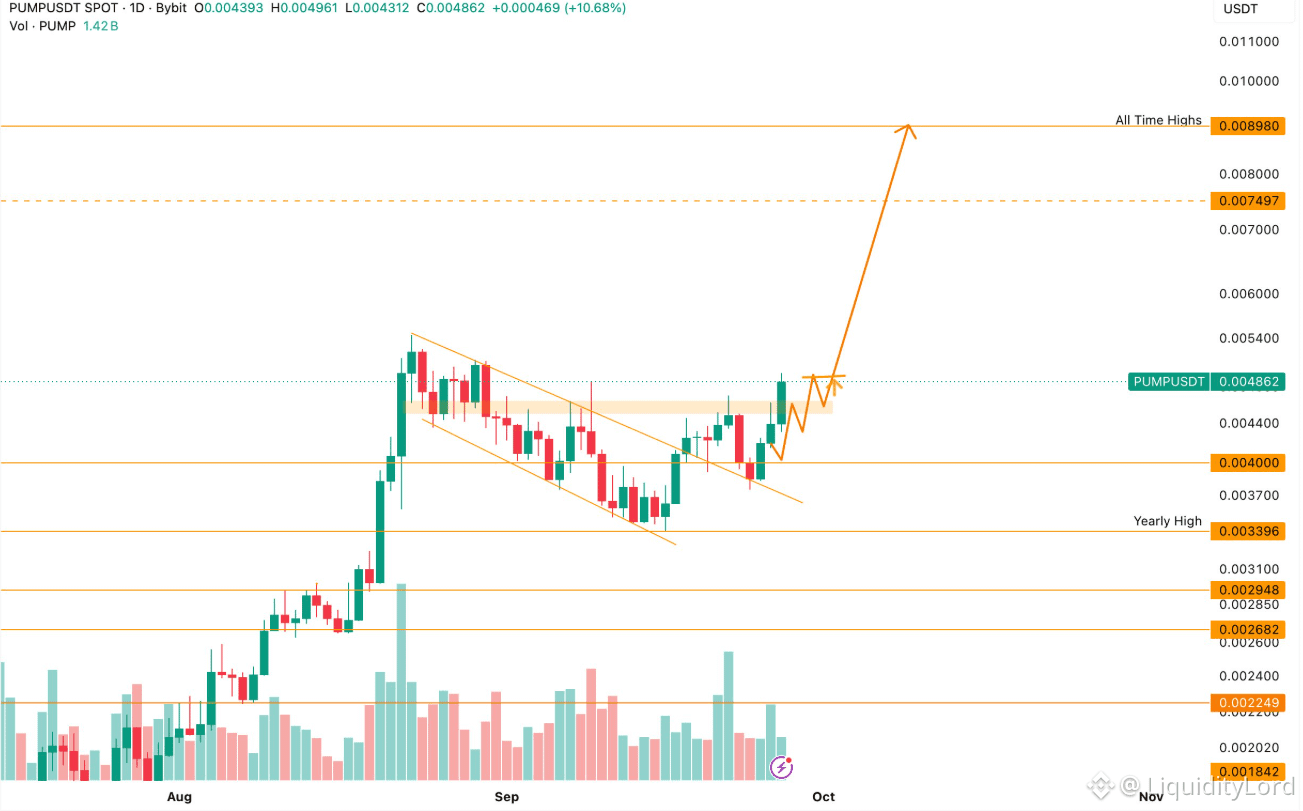
PUMP/USDT on the 1D chart is showing a structural shift after spending September inside a descending channel. Price has pushed above the upper boundary and reached 0.00486, putting the market back above 0.00400 and opening a new upside area.
📈 THE BREAKOUT STRUCTURE
Price formed lower highs inside the falling channel, then recovered from the 0.00340 yearly high area and reclaimed 0.00400. The next question is whether buyers can defend the breakout. A successful retest would create a stronger continuation structure, while a move back below the channel would weaken the signal.
🎯 TRADE PARAMETERS
Entry: 0.00445–0.00475
Invalidation: 0.00400
TP1: 0.00540
TP2: 0.00750
TP3: 0.00898
Stop Loss: 0.00395
TP1 is the first upside reference. TP2 sits near the marked 0.007497 level, while TP3 approaches the 0.008980 all-time-high reference. A daily close below 0.00400 would invalidate the immediate continuation idea.
🧭 LEVELS THAT MATTER
0.00400 is now the main structural checkpoint. Above it, 0.00540 becomes the first resistance objective. If momentum continues, 0.00750 and 0.00898 become the larger chart references. The 0.00440–0.00450 area is the first retest zone to watch before continuation.
⚙ EXECUTION AND LIQUIDITY
A move from below value can get messy once traders rush the rotation. This is where ST0Nfi fits naturally into the execution side: its infrastructure can compare available liquidity routes and quotes before a swap is executed, helping traders evaluate how different liquidity sources may affect the final fill.
For PUMP, the map is straightforward: 0.00400 is the structural line, 0.00540 is the first upside checkpoint, and 0.00750–0.00898 are the larger chart objectives. The key confirmation is whether price can hold the breakout instead of falling back into the old channel.
NFA - DYOR
$PUMP
PUMP/USDT on the 1D chart is showing a structural shift after spending September inside a descending channel. Price has pushed above the upper boundary and reached 0.00486, putting the market back above 0.00400 and opening a new upside area.
📈 THE BREAKOUT STRUCTURE
Price formed lower highs inside the falling channel, then recovered from the 0.00340 yearly high area and reclaimed 0.00400. The next question is whether buyers can defend the breakout. A successful retest would create a stronger continuation structure, while a move back below the channel would weaken the signal.
🎯 TRADE PARAMETERS
Entry: 0.00445–0.00475
Invalidation: 0.00400
TP1: 0.00540
TP2: 0.00750
TP3: 0.00898
Stop Loss: 0.00395
TP1 is the first upside reference. TP2 sits near the marked 0.007497 level, while TP3 approaches the 0.008980 all-time-high reference. A daily close below 0.00400 would invalidate the immediate continuation idea.
🧭 LEVELS THAT MATTER
0.00400 is now the main structural checkpoint. Above it, 0.00540 becomes the first resistance objective. If momentum continues, 0.00750 and 0.00898 become the larger chart references. The 0.00440–0.00450 area is the first retest zone to watch before continuation.
⚙ EXECUTION AND LIQUIDITY
A move from below value can get messy once traders rush the rotation. This is where ST0Nfi fits naturally into the execution side: its infrastructure can compare available liquidity routes and quotes before a swap is executed, helping traders evaluate how different liquidity sources may affect the final fill.
For PUMP, the map is straightforward: 0.00400 is the structural line, 0.00540 is the first upside checkpoint, and 0.00750–0.00898 are the larger chart objectives. The key confirmation is whether price can hold the breakout instead of falling back into the old channel.
NFA - DYOR
$PUMP