#BTC #ETH
Follow
And claim the reward
Technical Chart Breakdown:
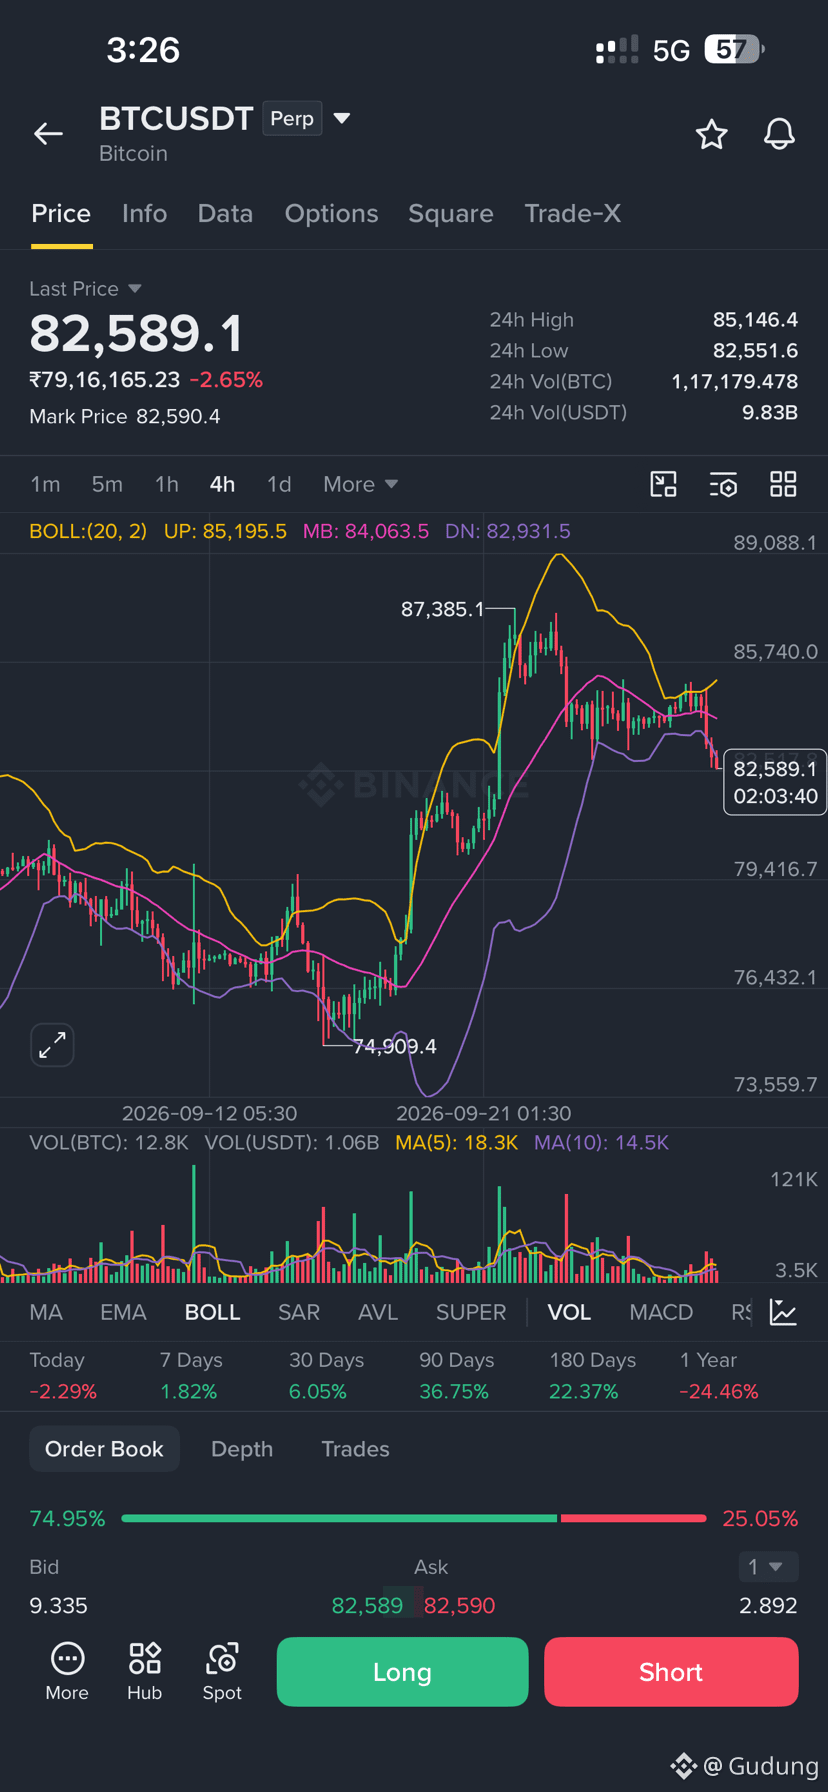
BTC/USDT 4H
Current Price & Momentum:
BTC is trading around $82,589, printing a long bearish candle that has breached below the lower Bollinger Band (DN: $82,931).
This indicates strong short-term downward momentum and an oversold condition on this timeframe.
Moving Averages & Bollinger Bands: The price failed to sustain above the Middle Band (MB: $84,063) and has broken down sharply. The Upper Band stands at $85,195, marking overhead resistance.
Key Support Levels:
Immediate support lies between $81,000 – $81,500 psychological and prior structure zone.
Major macro support rests at $74,900 – $76,400 the base swing low established in mid-September
Key Resistance Levels:
First resistance is the 20-period moving average / mid-band around $84,000 – $84,400.
Critical swing high resistance sits at $87,385.
Order Book Sentiment: The displayed order book shows 74.95% Long vs. 25.05% Short, reflecting heavy retail buyer positioning. When open sentiment leans heavily to one side during a sharp breakdown, there is an elevated risk of long liquidations cascading further down.
Realistic Trade & Risk Management
1. Avoid Impulsive Market Longs: Waiting for the current 4H candle to close (roughly 2 hours remaining on this candle) confirms whether the breakdown below $82,900 sticks or forms a liquidity reclaim wick.
2. Scenarios to Watch:
Bearish Continuation: If the 4H closes solidly below $82,500, expect price to test the next demand block around $80,000 – $81,000.
Mean Reversion Bounce: If buyers defend the $82,000 area and close back inside the Bollinger Bands above $83,000, a relief test back toward $84,000 becomes possible.
3. Execution Rules:
Limit single-trade exposure to 1%–2% of total account margin.
If trading perpetual futures, set hard invalidation stops outside swing levels rather than averaging down into high leverage.
Follow
And claim the reward
Technical Chart Breakdown:
BTC/USDT 4H
Current Price & Momentum:
BTC is trading around $82,589, printing a long bearish candle that has breached below the lower Bollinger Band (DN: $82,931).
This indicates strong short-term downward momentum and an oversold condition on this timeframe.
Moving Averages & Bollinger Bands: The price failed to sustain above the Middle Band (MB: $84,063) and has broken down sharply. The Upper Band stands at $85,195, marking overhead resistance.
Key Support Levels:
Immediate support lies between $81,000 – $81,500 psychological and prior structure zone.
Major macro support rests at $74,900 – $76,400 the base swing low established in mid-September
Key Resistance Levels:
First resistance is the 20-period moving average / mid-band around $84,000 – $84,400.
Critical swing high resistance sits at $87,385.
Order Book Sentiment: The displayed order book shows 74.95% Long vs. 25.05% Short, reflecting heavy retail buyer positioning. When open sentiment leans heavily to one side during a sharp breakdown, there is an elevated risk of long liquidations cascading further down.
Realistic Trade & Risk Management
1. Avoid Impulsive Market Longs: Waiting for the current 4H candle to close (roughly 2 hours remaining on this candle) confirms whether the breakdown below $82,900 sticks or forms a liquidity reclaim wick.
2. Scenarios to Watch:
Bearish Continuation: If the 4H closes solidly below $82,500, expect price to test the next demand block around $80,000 – $81,000.
Mean Reversion Bounce: If buyers defend the $82,000 area and close back inside the Bollinger Bands above $83,000, a relief test back toward $84,000 becomes possible.
3. Execution Rules:
Limit single-trade exposure to 1%–2% of total account margin.
If trading perpetual futures, set hard invalidation stops outside swing levels rather than averaging down into high leverage.