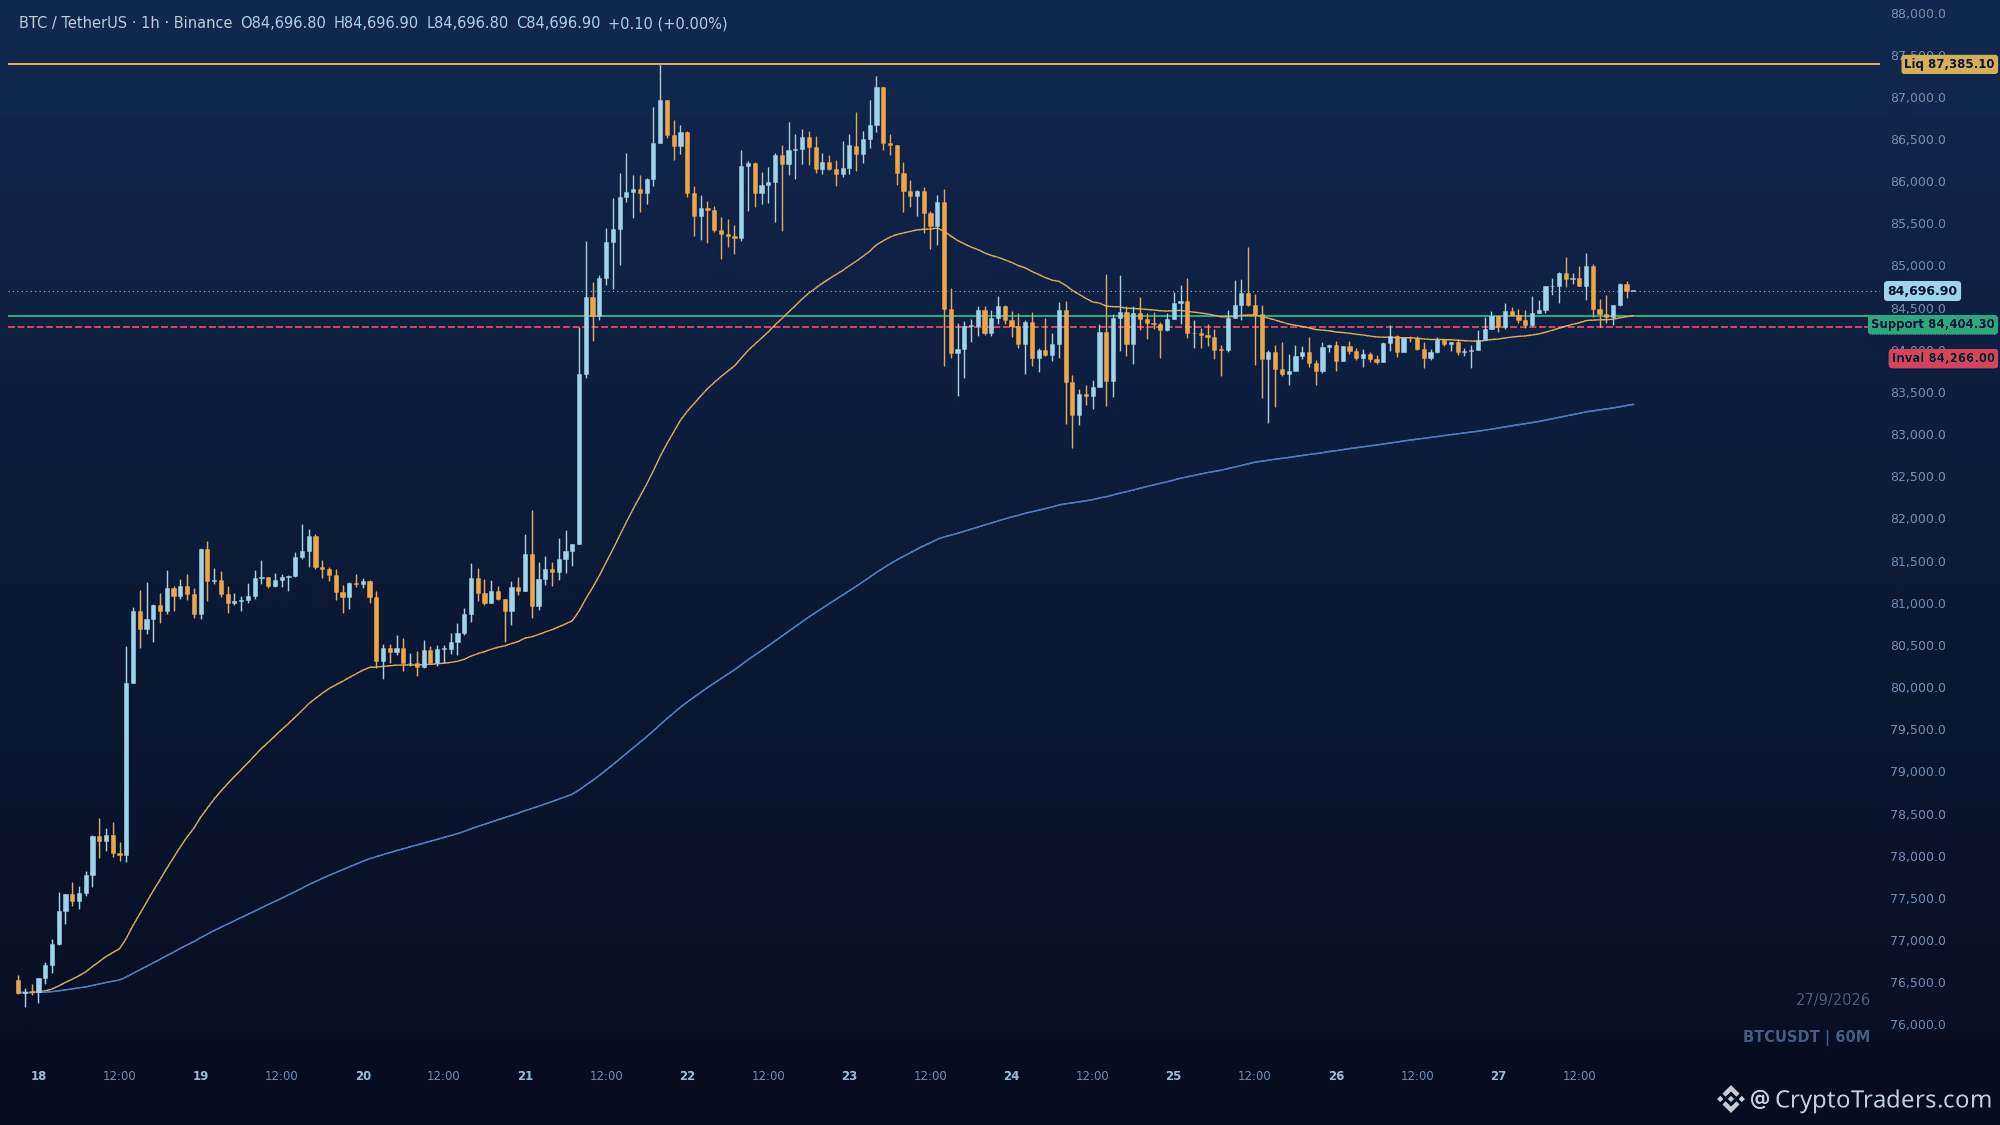
$BTC is up 0.9 percent in 24h and just pushed back above the consolidation highs, so the next hour decides if this holds or fades. The 1h chart shows a local break of structure after basing around 83,800 to 84,300, with price now sitting in the upper half of the range. The line that matters is 84,266. Hold above it and the 84,400 to 84,300 demand zone is the pullback area before a run at 87,385. Lose it and the breakout is just a wick. 50 EMA sits right at 84,404, so that zone is the first real test on any dip. Does 84,266 hold on the next retest, or does this fade back into the base? More charts like this land in the group daily, bio has the details. #BTC Price Analysis# #Bitcoin Price Prediction: What is Bitcoins next move?#