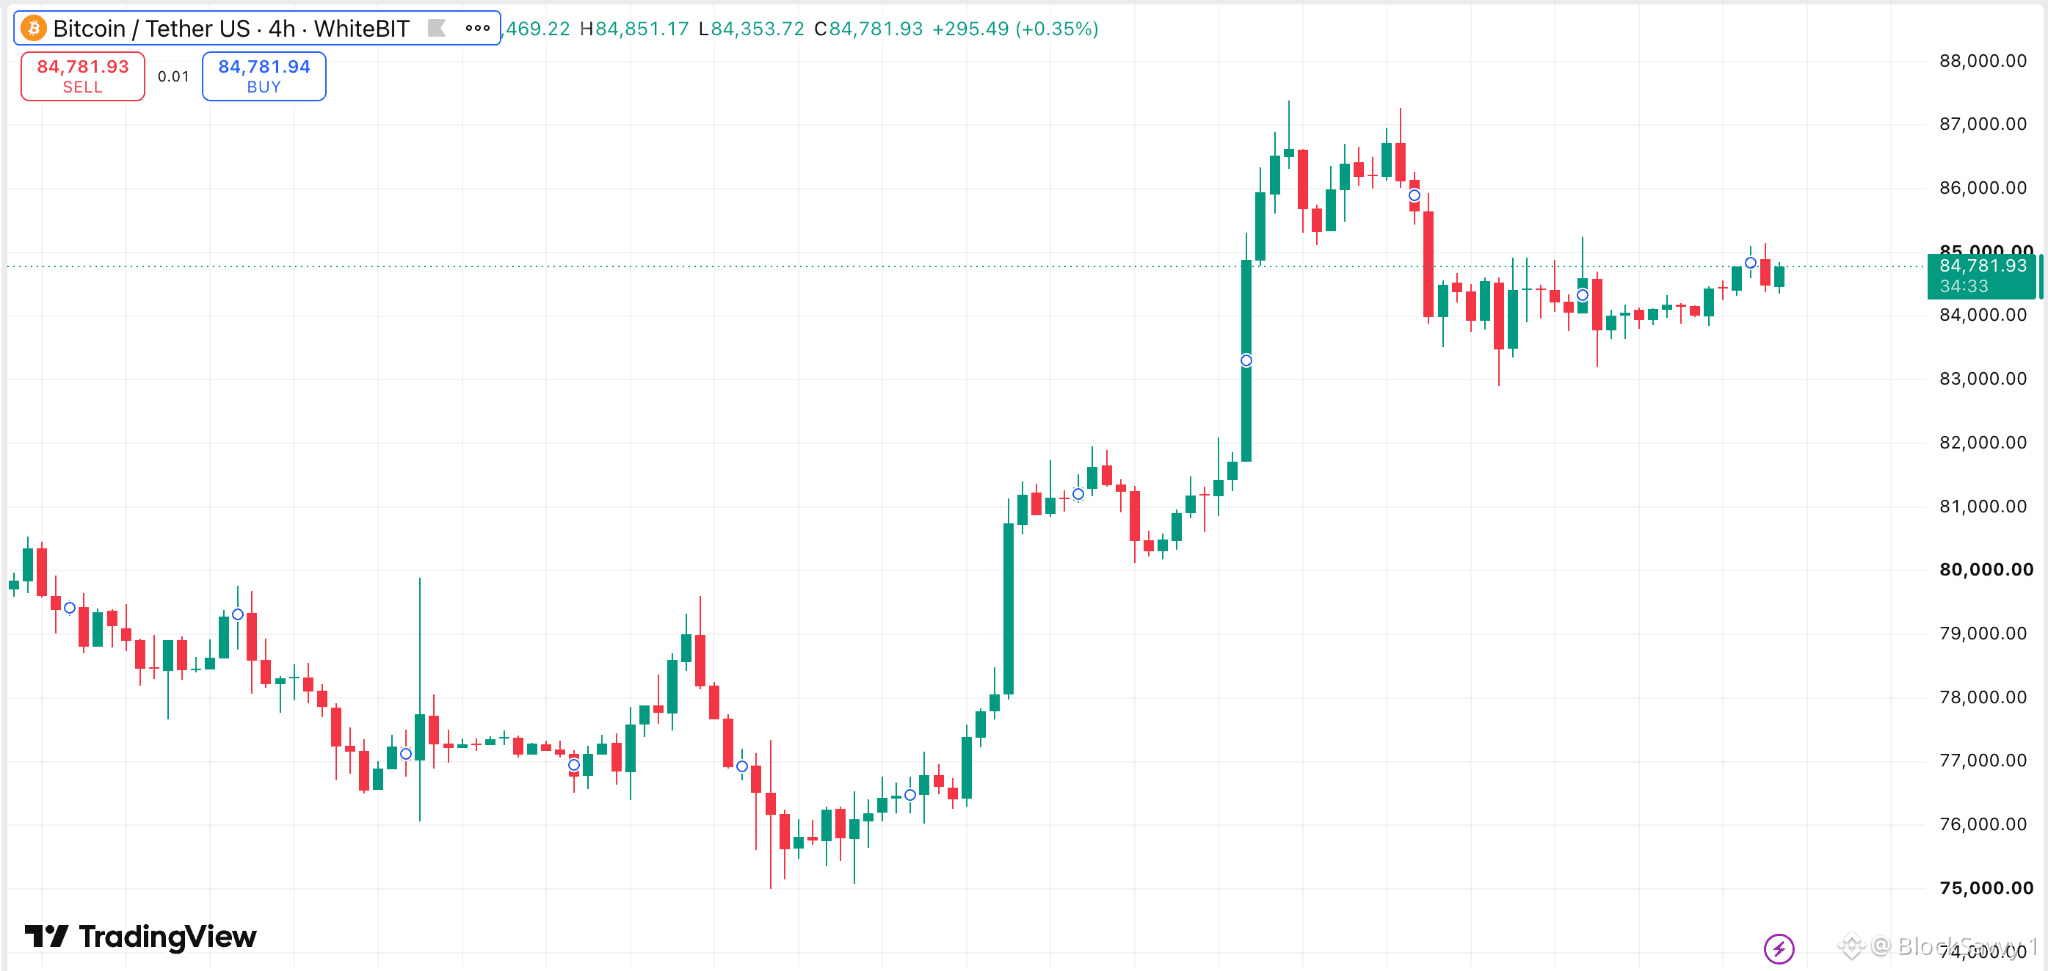
Bitcoin Is Doing Something Traders Usually Hate: Nothing After the move from roughly $75K to above $87K, $BTC has spent the last few days hanging around the $84K-$85K area. The 4-hour chart captures it pretty well: a sharp repricing higher, a pullback, and then a surprisingly tight cluster of candles rather than an immediate continuation or reversal. The timing is useful context. Treasury yields recently jumped to their highest levels since 2007 and expectations for further Fed hikes increased, both of which put pressure on risk assets. Bitcoin briefly slipped toward $83K, but buyers pulled it back into the mid-$84Ks. That’s why I’ve been checking the wider market alongside this range on TradingView. With WhiteBIT TradFi available there too, it’s easier to keep the traditional market setups beside $BTC and see whether they start moving together again. At the same time, holders are taking profits. On-chain realized profit data shows selling after BTC’s strong quarter, but the pace has been considerably slower than around previous major market peaks. So the boring part of this chart might actually be the part worth watching. $BTC absorbed a fast rally, profit-taking and a tougher rates backdrop without immediately giving the breakout back. Now I’d be watching whether this range becomes a base for another attempt higher, or simply the place where buyers finally run out of patience. #BTC Price Analysis# #Bitcoin Price Prediction: What is Bitcoins next move?#