#BitwiseFilesFinalNEARSpotETFProspectus #DogecoinETFsPostBiggestWeekSinceLaunch #StrategyStriveAdd2305BitcoinThisWeek #TrumpRejectsIranHormuzReopening
Bitcoin (BTC) Price Analysis
Recent Trend: Consolidation Near Resistance
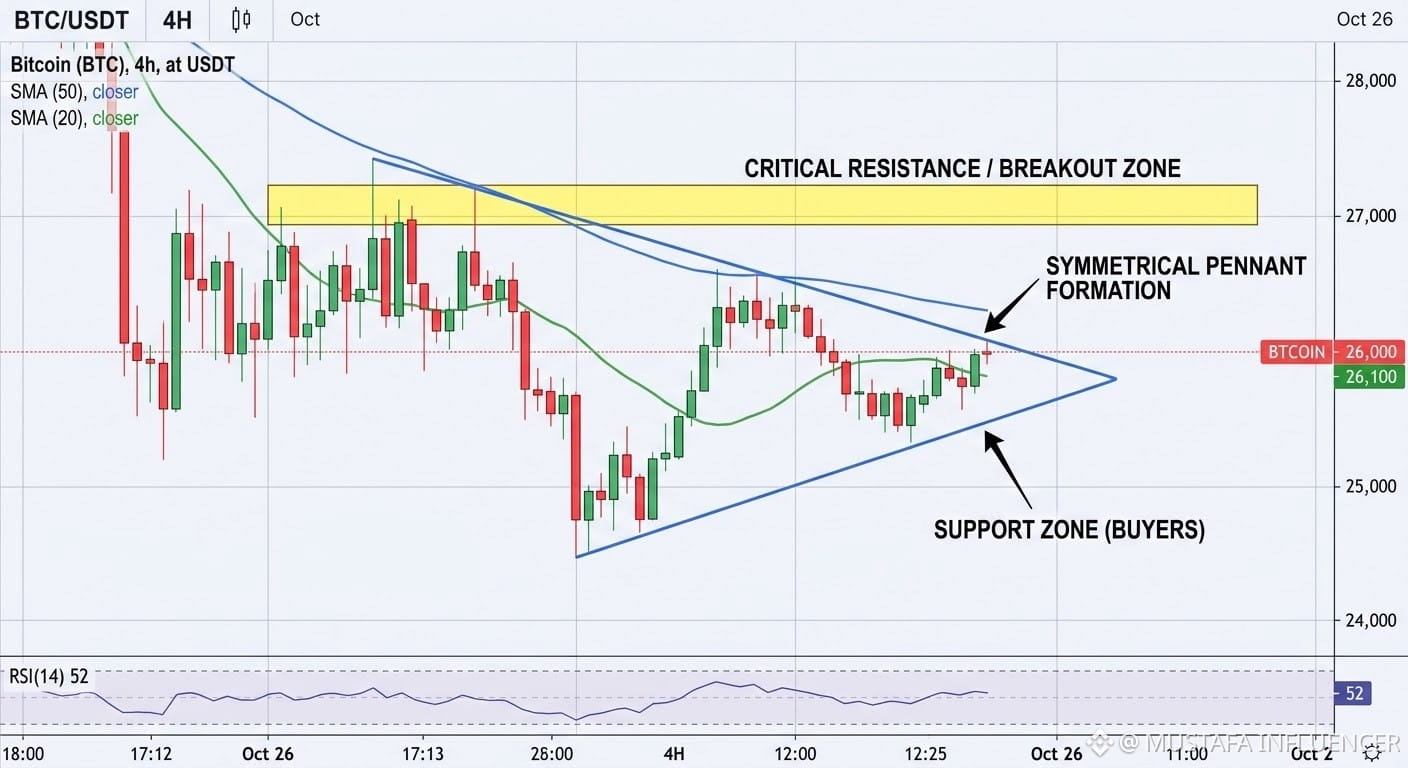
Bitcoin has been consolidating within a tight range, specifically between $25,800 and $26,800. After a swift recovery from August's lows, the price action has flattened, reflecting market indecision. The chart highlights that the $27,000 level remains a significant psychological and technical hurdle for bulls.
Key Indicators and Levels
The provided chart is illustrating several critical factors for traders to watch:
Moving Averages: The 20-period Moving Average (MA) on the 4-hour timeframe (green line) is currently flattened and actings: The 20-period Moving Average (MA) on the 4-hour timeframe (green line) is currently flattened and acting as immediate support. However, it is positioned just below the longer-term 50-period MA (blue line), which is often interpreted as a cautious or "bearish cross" in the short term. The price needs to reclaim the 50 MA to signal a genuine shift in momentum.
The Squeeze Zone: The visual highlighting of a "squeeze zone" near $27,000 indicates the potential for a volatile breakout. This pattern usually precedes a sharp move as trading ranges contract and energy builds.
Outlook and Potential Triggers
While the immediate sentiment is neutral-to-cautious, a breakout in either direction is likely.
Bullish Scenario: A sustained daily close above $27,200 (breaking the squeeze and the 50 MA) could trigger a short-covering rally toward the major psychological resistance at $28,000 or $28,500. This could be catalyzed by positive spot ETF news or favorable macro data.
Bearish Scenario: A failure to hold the support at $25,800 would likely invalidate the current recovery and could lead to a retest of the $25,000 support floor. A deeper correction might see $24,200 as the next major defensive line for buyer#BitwiseFilesFinalNEARSpotETFProspectus
Bitcoin (BTC) Price Analysis
Recent Trend: Consolidation Near Resistance
Bitcoin has been consolidating within a tight range, specifically between $25,800 and $26,800. After a swift recovery from August's lows, the price action has flattened, reflecting market indecision. The chart highlights that the $27,000 level remains a significant psychological and technical hurdle for bulls.
Key Indicators and Levels
The provided chart is illustrating several critical factors for traders to watch:
Moving Averages: The 20-period Moving Average (MA) on the 4-hour timeframe (green line) is currently flattened and actings: The 20-period Moving Average (MA) on the 4-hour timeframe (green line) is currently flattened and acting as immediate support. However, it is positioned just below the longer-term 50-period MA (blue line), which is often interpreted as a cautious or "bearish cross" in the short term. The price needs to reclaim the 50 MA to signal a genuine shift in momentum.
The Squeeze Zone: The visual highlighting of a "squeeze zone" near $27,000 indicates the potential for a volatile breakout. This pattern usually precedes a sharp move as trading ranges contract and energy builds.
Outlook and Potential Triggers
While the immediate sentiment is neutral-to-cautious, a breakout in either direction is likely.
Bullish Scenario: A sustained daily close above $27,200 (breaking the squeeze and the 50 MA) could trigger a short-covering rally toward the major psychological resistance at $28,000 or $28,500. This could be catalyzed by positive spot ETF news or favorable macro data.
Bearish Scenario: A failure to hold the support at $25,800 would likely invalidate the current recovery and could lead to a retest of the $25,000 support floor. A deeper correction might see $24,200 as the next major defensive line for buyer#BitwiseFilesFinalNEARSpotETFProspectus