The Hidden Signal Inside Funding Rates
Most traders watch funding only when it turns extreme.
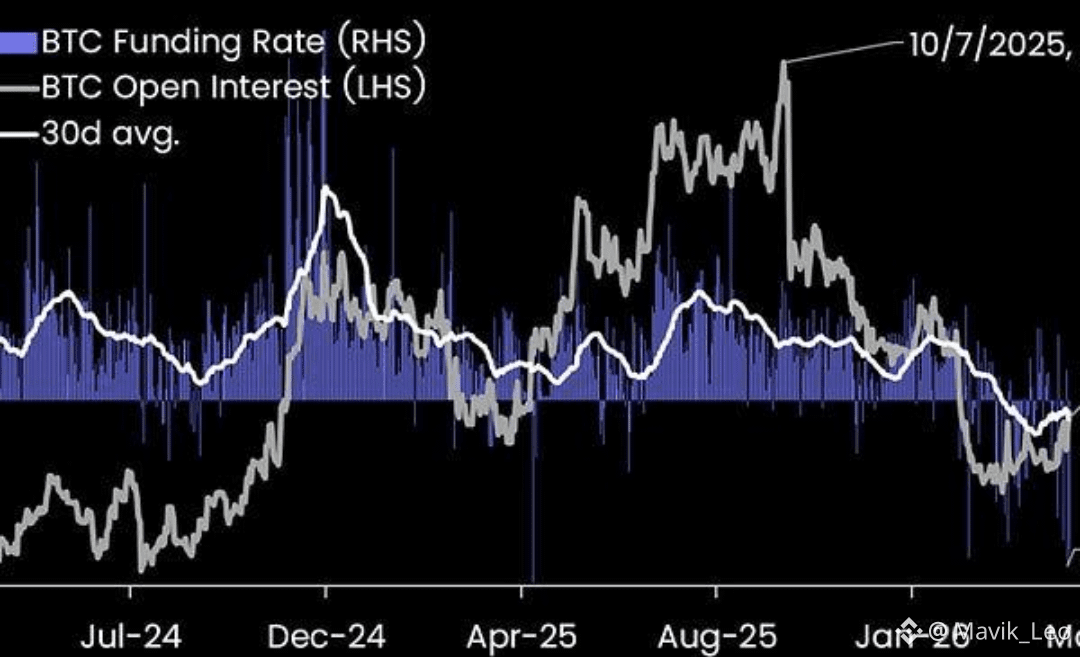
But the real signal is the relationship between funding and open interest.
BTC is around $84.4K, while funding remains positive but relatively controlled.
Meanwhile, total BTC open interest is around $54.7B.
That combination tells us something important:
Leverage exists, but traders aren’t paying extreme costs to chase BTC.
This is different from a heavily crowded long trade, where funding starts accelerating alongside open interest.
So I’m watching the relationship:
Price ↑ + OI ↑ + Funding stays controlled
That suggests positioning is building without obvious funding excess.
But if price rises while funding and OI suddenly spike, the risk of a crowded trade increases.
Funding tells you who is paying.
Open interest tells you how much positioning is underneath the move.
Together, they reveal what the price chart alone cannot:
Are traders building positions — or chasing the move?$QNT $GLMR $QI
Most traders watch funding only when it turns extreme.
But the real signal is the relationship between funding and open interest.
BTC is around $84.4K, while funding remains positive but relatively controlled.
Meanwhile, total BTC open interest is around $54.7B.
That combination tells us something important:
Leverage exists, but traders aren’t paying extreme costs to chase BTC.
This is different from a heavily crowded long trade, where funding starts accelerating alongside open interest.
So I’m watching the relationship:
Price ↑ + OI ↑ + Funding stays controlled
That suggests positioning is building without obvious funding excess.
But if price rises while funding and OI suddenly spike, the risk of a crowded trade increases.
Funding tells you who is paying.
Open interest tells you how much positioning is underneath the move.
Together, they reveal what the price chart alone cannot:
Are traders building positions — or chasing the move?$QNT $GLMR $QI