₿ Bitcoin Analysis
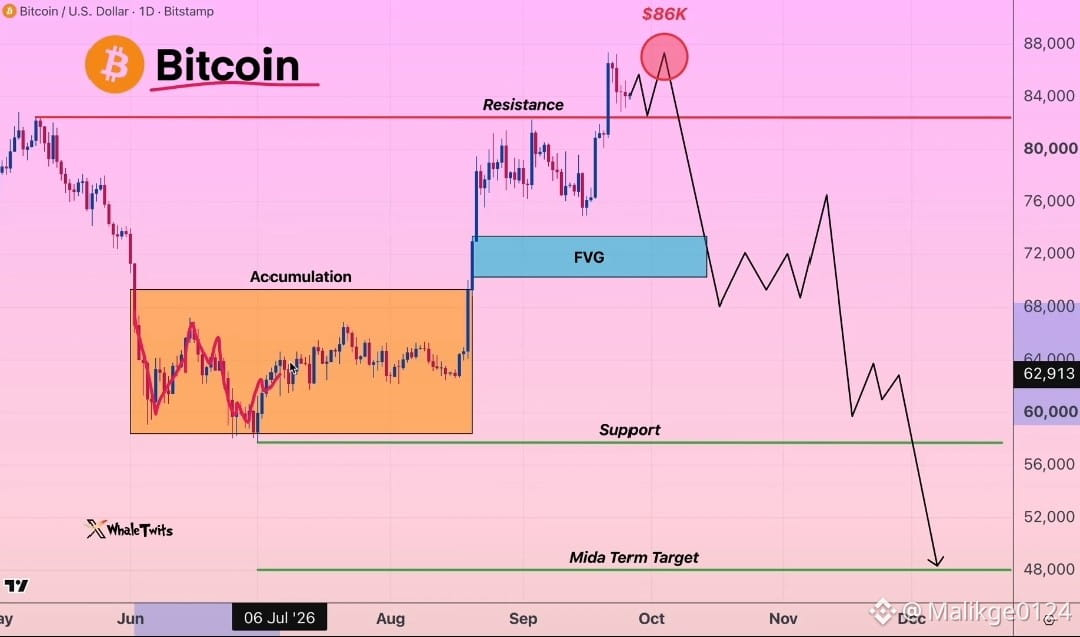
This chart outlines a possible bearish scenario for #Bitcoin. After breaking above the $82K resistance level, BTC may continue rising toward the $86K liquidity zone, where sellers could step in.
A pullback could then target the $69K–$72K Fair Value Gap (FVG), a key area often revisited by price. If bearish pressure increases, the next major support lies around $57K, with a deeper correction potentially extending toward $48K.
Key levels to watch are $86K resistance, $70K FVG, and $57K support. Bitcoin’s reaction around these zones may determine its next major move.
#Bitcoin #BTC #Crypto #Trading #TechnicalAnalysis
This chart outlines a possible bearish scenario for #Bitcoin. After breaking above the $82K resistance level, BTC may continue rising toward the $86K liquidity zone, where sellers could step in.
A pullback could then target the $69K–$72K Fair Value Gap (FVG), a key area often revisited by price. If bearish pressure increases, the next major support lies around $57K, with a deeper correction potentially extending toward $48K.
Key levels to watch are $86K resistance, $70K FVG, and $57K support. Bitcoin’s reaction around these zones may determine its next major move.
#Bitcoin #BTC #Crypto #Trading #TechnicalAnalysis