

August PCE prints Wednesday, September 30 at 8:30am ET (19:30 Vietnam). Same release: Q2 GDP third estimate and the BEA annual revision.
The Federal Reserve’s preferred inflation gauge is the last major data point before the October 28 FOMC. The tape into the print is not neutral. The dollar has reversed its August flush. The 10-year yield has cleared 5%. Gold gave back the $4,700 spike and is sitting on $4,250–4,280. Bitcoin, unlike the metals, held the $80k break and is coiled under $87,500.
This note maps the data, the cross-asset setup, and the levels that matter after 8:30am ET.
1. What is actually printing
The Personal Income and Outlays report carries headline PCE and core PCE (ex-food and energy). Core is the policy series. Headline still moves the first 15 minutes because energy can swing the print.
July already in the books:
Headline PCE: +3.7% YoY / +0.2% MoM
Core PCE: +3.3% YoY / +0.2% MoM
Fed target: 2%
Street / nowcast into August is roughly headline 3.8% YoY, core 3.3–3.4% YoY, core MoM 0.2–0.3%.
Two extra wrinkles on September 30:
Q2 GDP third estimate lands in the same 8:30am slot.
BEA starts the 2026 annual update of the National Accounts. Prior-year PCE can be revised. The market will trade August and the revision, not August alone.
2. The inflation backdrop: disinflation stalled
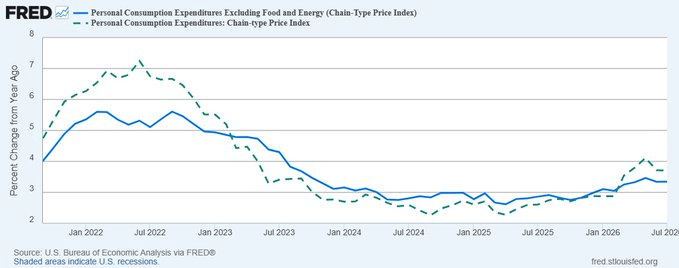
Headline PCE (dashed) and core PCE (solid), percent change from year ago. July: core 3.3%, headline 3.7%. Both have re-accelerated from the 2025 floor near 2.1–2.5%. Source: BEA via FRED.
The 2023–2025 downtrend is no longer the story. Headline peaked near 7% in mid-2022; core peaked near 5.5%. Both compressed into 2024–2025, then turned higher again through 2026. Headline is running above core once more — energy and food — but policy still keys off the solid line.
That is why a 0.1 point move in core YoY matters more than a noisy headline beat.
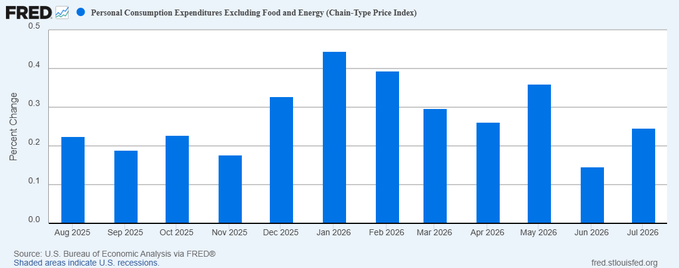
Core PCE month-over-month. This is the number futures trade. January printed 0.43%; June cooled to 0.13%; July returned to 0.23%. August consensus sits in the 0.2–0.3% band. Source: BEA via FRED.
Read Figure 2 as a traffic light:
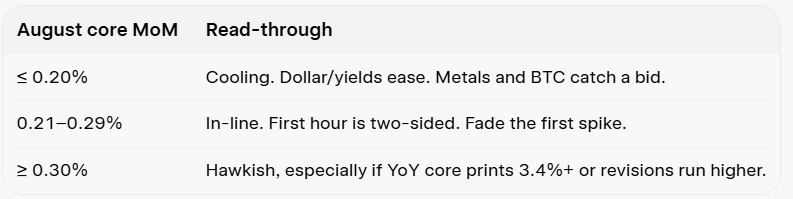
MoM is the catalyst. YoY is the narrative Fed officials have to defend.
3. Dollar: August low is gone, July supply is back
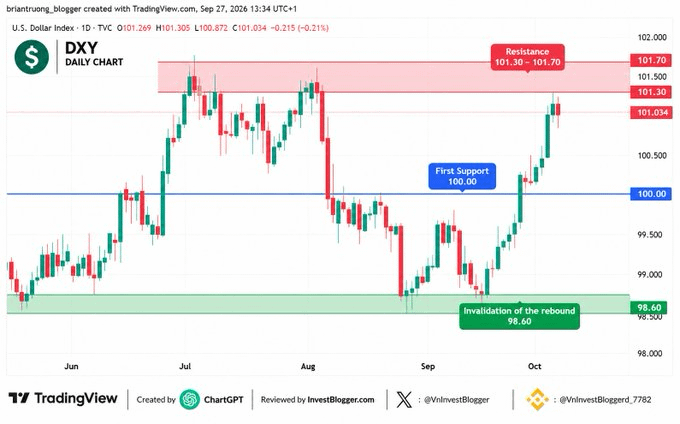
DXY daily : Price 101.03. The August slide into 98.60 has been fully reversed. Spot is back inside the June–July supply band at 101.30–101.70. Support: 100.00, then 98.60.
The daily chart is a V. June–July pushed toward 101.70. August flushed the index to 98.60. September bought every dip and delivered price back to the same ceiling it failed under in July.
That makes 101.30–101.70 the first decision zone after PCE — not 99.
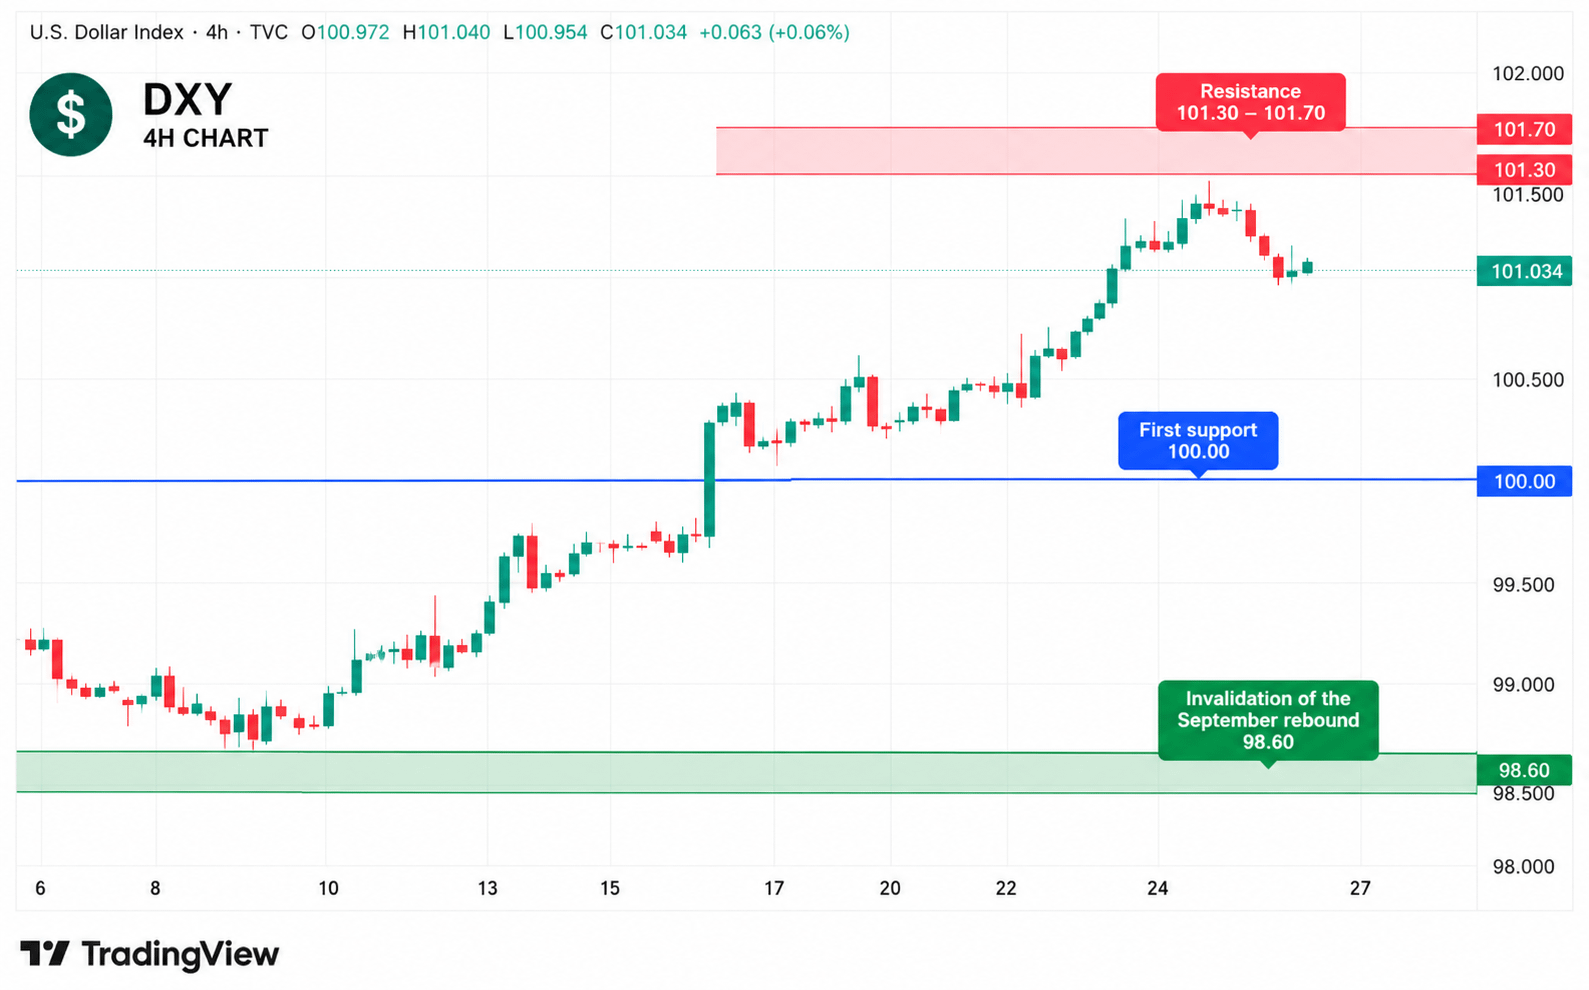
Chart DXY 4-hour: Stair-step advance from ~98.70 to 101.40, now digesting just above 101.00. A soft print that loses 100.50–100.00 would argue the squeeze is done. A hot print through 101.40 opens the July high.
Tactical map:
Resistance: 101.30–101.70
First support: 100.00
Invalidation of the September rebound: 98.60
Hot PCE keeps DXY in the 101.70 handle. Soft PCE puts 100.00 back in play on the same session.
4. The cleaner signal is the 10-year
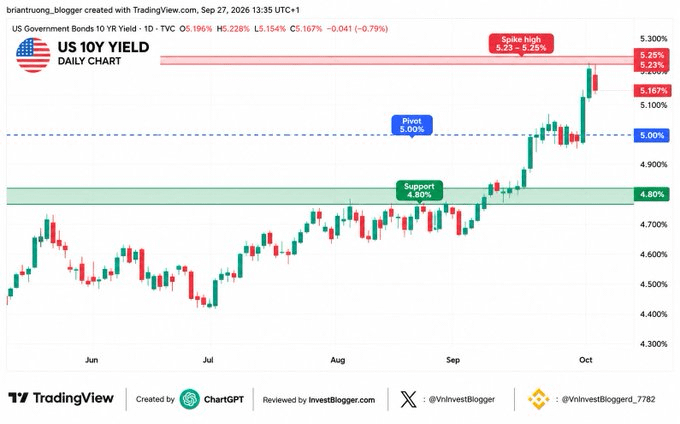
US 10-year yield, daily :Last 5.17%. The trend from the July 4.38% low is intact. 5.00% has flipped from cap to floor. Spike high: 5.23–5.25%. Deeper support: 4.80%. Source: TradingView / TVC.
Equities can shrug a firm dollar for a session. Gold and Bitcoin do not shrug a 10-year at 5.25%.
The yield chart is why metals sold September and why this PCE is not a routine mid-cycle print. 5.00% is no longer the upside target. It is the first level bulls in duration need back.
Cap: 5.23–5.25%
Pivot: 5.00%
Relief level: 4.80%
A core miss that cannot push 10Y back under 5.00% is not a full easing signal. A core beat that holds 5.25% keeps pressure on every duration-sensitive asset.
5. Gold: $4,700 failed. $4,250 is the line.
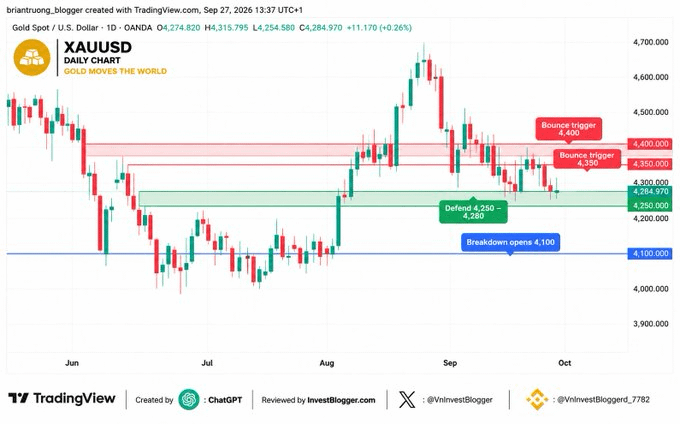
Gold spot, daily (XAUUSD 1D): Last $4,285. The August squeeze into ~$4,700 reversed as DXY and 10Y turned higher. Price is sitting on the $4,250–4,280 shelf. Next resistance: $4,350, then $4,400. Breakdown opens $4,100. Source: TradingView / OANDA.
Gold did the textbook thing. Real-rate and dollar pressure returned; the metal gave back the squeeze. The bull case from here is not “new highs this week.” It is whether $4,250–4,280 holds through the print.
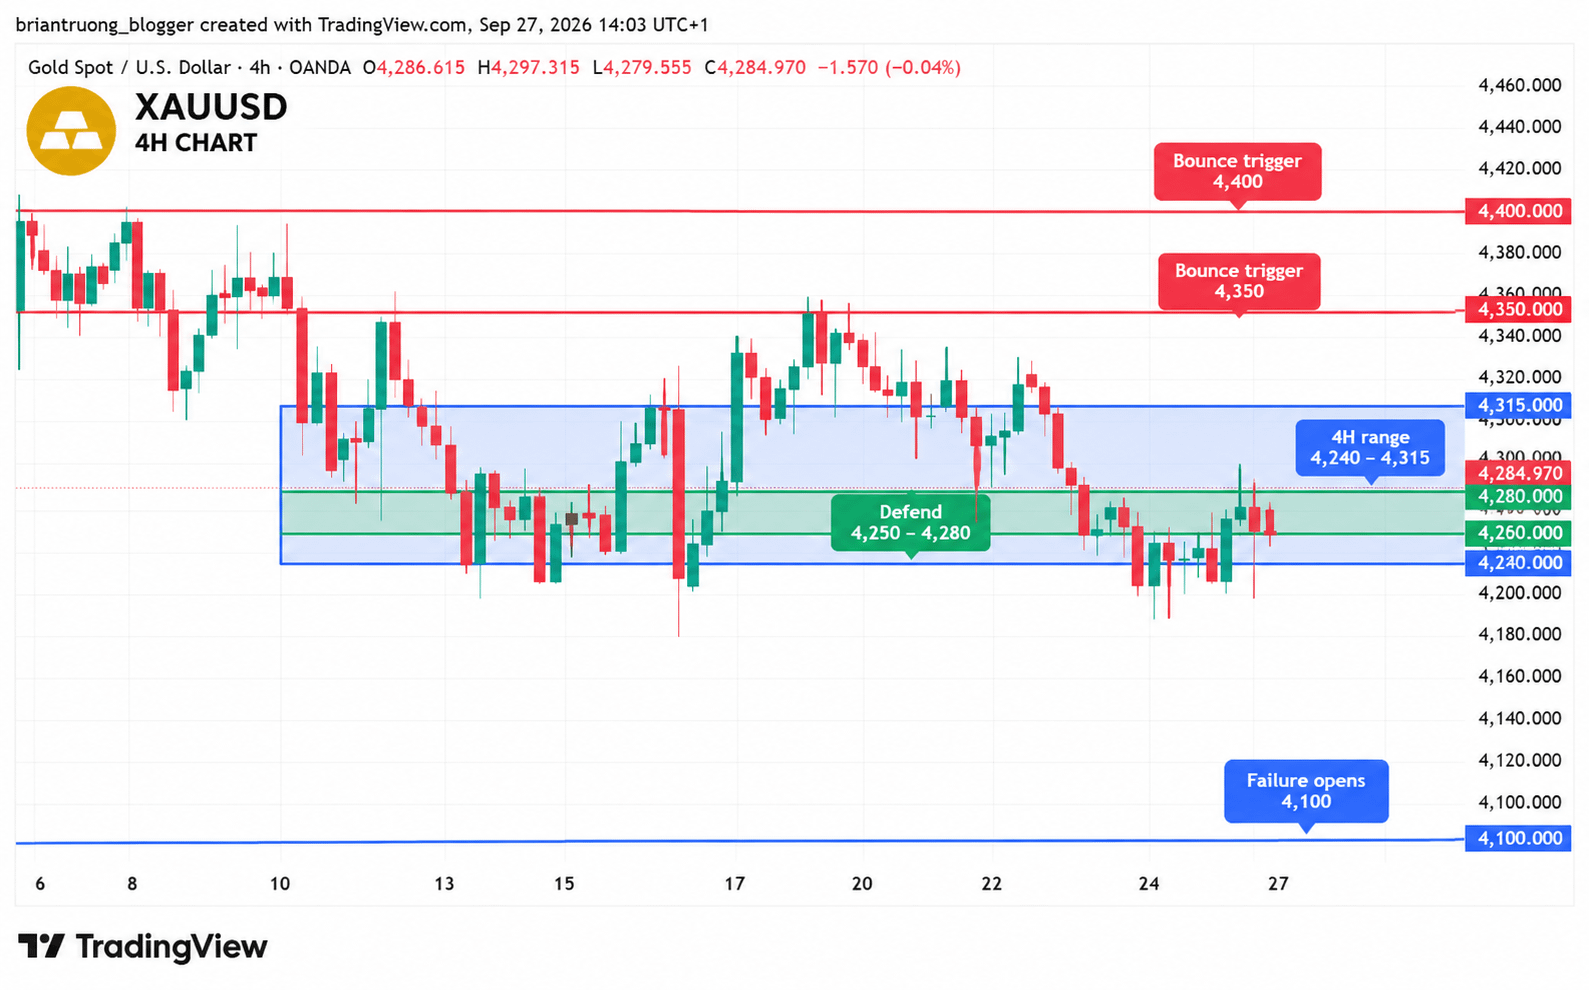
Gold 4-hour : Downtrend from the September 6 high near $4,480 into a $4,240–4,315 coil. PCE will break this range. Hold $4,250 and $4,315 is the first squeeze level. Lose $4,240 and the daily shelf is gone. Source: TradingView / OANDA.
Gold map:
Defend: $4,250–4,280
Bounce triggers: $4,350, then $4,400
Failure opens: $4,100
Range on 4H: $4,240–4,315
6. Silver follows gold, with more torque
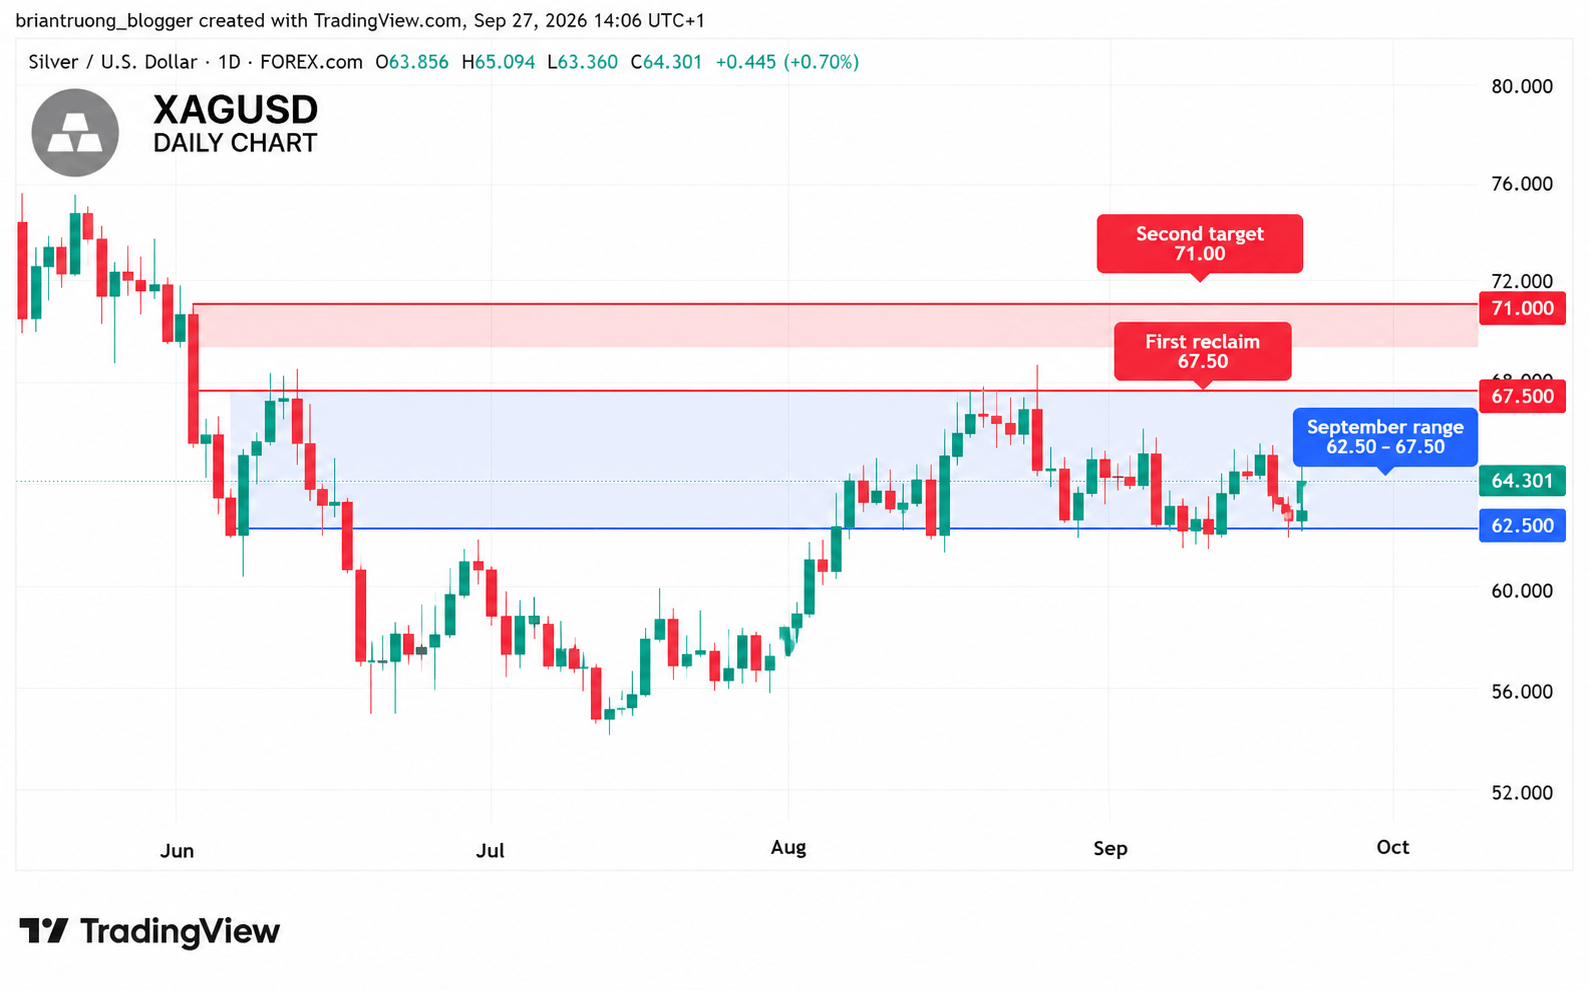
Silver daily(XAGUSD 1D): Last $64.31. Same macro shape as gold, larger amplitude: June crash from the $80s toward $55, August bounce toward $71, September digesting $62.50–67.50. Gold/silver ratio near 66.6. Source: TradingView / OANDA.
Silver is the high-beta expression of the same trade. If gold holds $4,250 and PCE cools, silver’s first reclaim is $67.50, then the September high near $71. If gold loses $4,250, silver $62.50 is the level that matters — not $64.
Do not treat silver as an independent PCE call this week. It is gold with leverage.
7. Bitcoin is the divergence
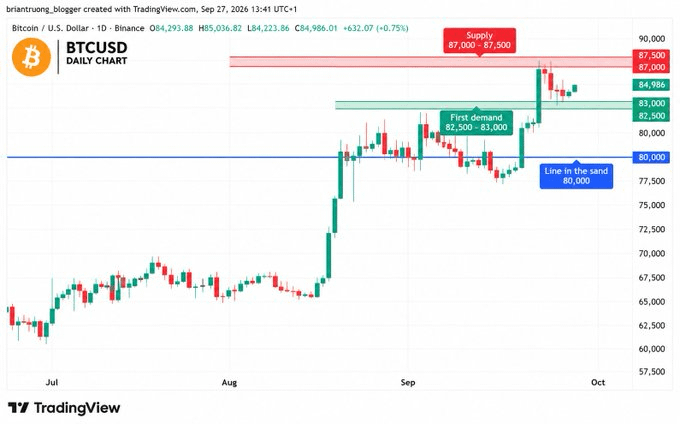
BTCUSD 1D : Bitcoin daily, Binance. Last $84,990. Metals sold the yield spike. BTC did not. The $80,000 break held; price tagged $87,500 and is digesting $85,000. Supply: $87,000–87,500. First demand: $82,500–83,000. Line in the sand: $80,000. Source: TradingView / Binance.
This is the most useful cross-asset observation on the desk. Gold and silver responded to 10-year 5% like store-of-value assets under rate pressure. Bitcoin held a higher low and printed a higher high.
That can mean two things, and PCE will sort them:
BTC has a separate bid (positioning, ETF flow, residual risk-on) and will lead if yields fade.
BTC is late, and a hot print that lifts 10Y to 5.25%+ pulls it back toward $83k and $80k.
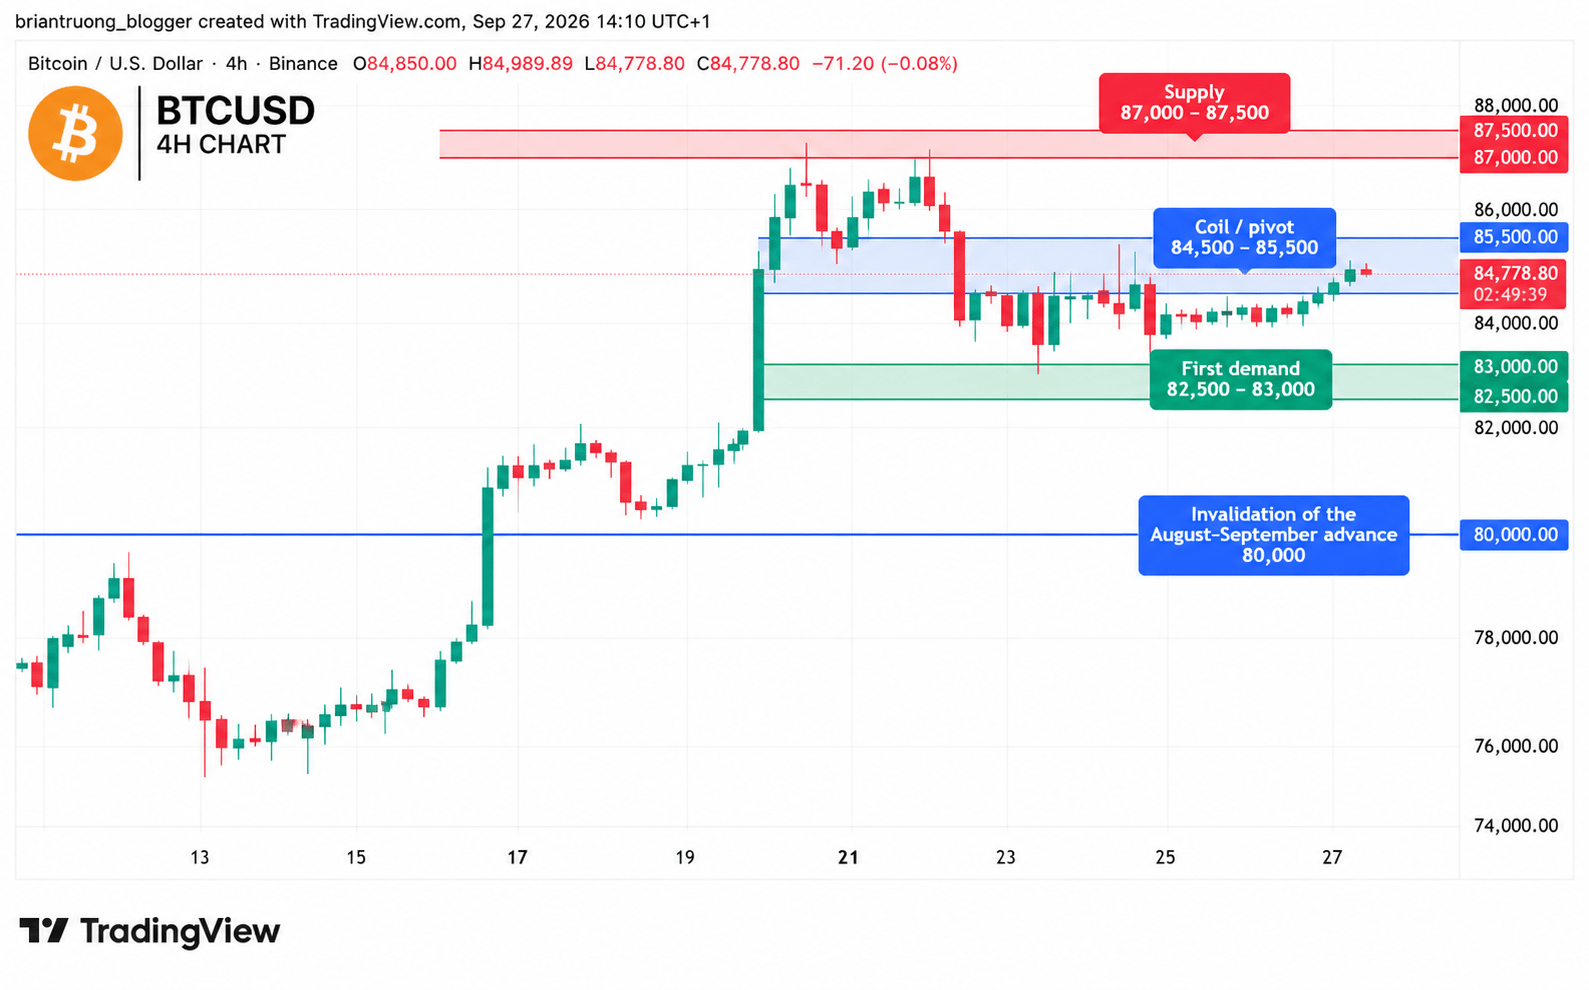
BTC 4H (Bitcoin 4-hour): Impulse from $75,000 to $87,500, then a tight coil under $85,000–86,500. Demand on this frame is $83,000–84,000. A soft PCE favors a $87,500 retest. A hot PCE tests $83,000 first. Source: TradingView / Binance.
BTC map:
Supply: $87,000–87,500
Coil / pivot: $84,500–85,500
First demand: $82,500–83,000
Invalidation of the August–September advance: $80,000
8. How the four assets should move together
PCE does not reprice gold, silver, dollar and Bitcoin independently. It reprices the real-rate / dollar complex. The rest is beta.
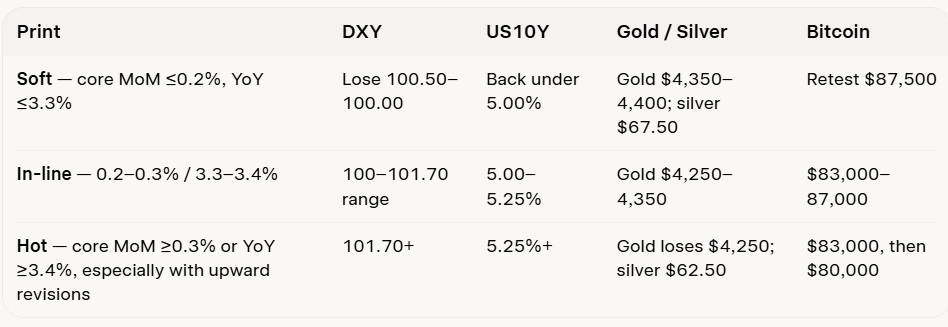
One extra rule for this release: if August MoM is contained but BEA revises 2025–26 YoY higher, treat it as the hot case. The annual update is not a footnote.
9. What to do with the charts on Wednesday
Do not invent a new thesis at 8:31am. Trade the levels already on the page.
Wait for the core MoM and the revision language. The headline is noise if core and revisions disagree.
First 15 minutes are for stops. First usable signal is whether DXY holds 101.00 or loses 100.50, and whether 10Y holds 5.00%.
Gold is a $4,250 story, not a $4,700 story, until that shelf is recovered through $4,350.
Bitcoin is only “decoupled” while $83,000 holds. Below that, it is trading the same yield shock as gold — just later.
BOTTOM LINE
The pre-PCE setup is asymmetric and already visible on the charts.
Dollar and yields have done the work. DXY is back at 101 and the 10-year is above 5%. That is a hawkish starting point, not a blank slate.
Gold is defensive, not broken — yet. $4,250–4,280 is the line. Hold it through a contained print and $4,350 is the squeeze. Lose it on a 0.3% core and $4,100 comes into view.
Bitcoin is the tell. It refused to sell the first yield spike. Wednesday decides whether that was strength or lag.
Data at 8:30am ET / 19:30 Vietnam, Wednesday, September 30. Levels first. Narrative second.
Market commentary only. Not investment advice. Levels refer to spot/index prints on the attached charts as of September 27, 2026.
By BRIAN TRUONG
TRADE/HOLD $XAU , $BTC , $XAG HERE👇