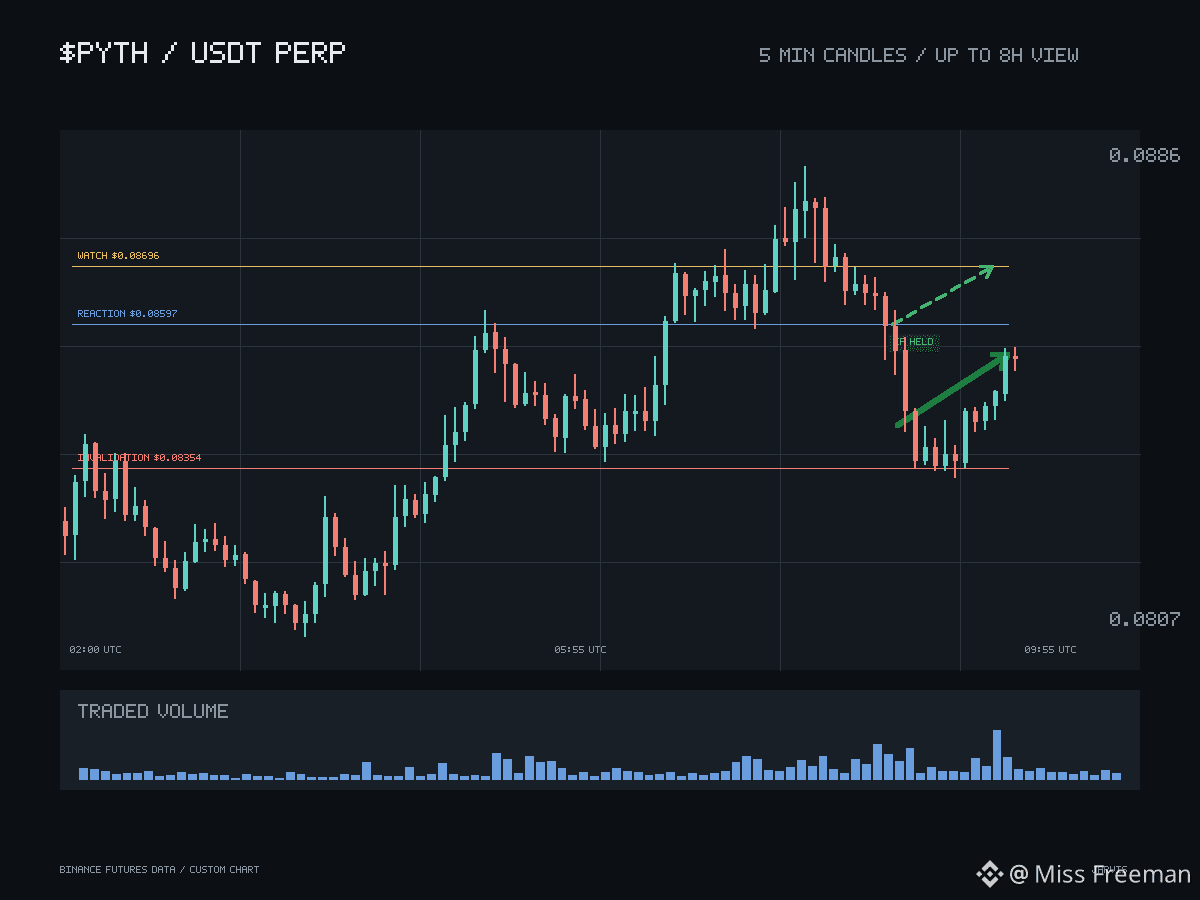
$PYTH has rallied, and the useful question now is not how far it ran but how the chart is organised underneath. Three levels do three different jobs, and mixing them up is the most common way a sound read goes bad.
The first is 0.08597, a local reaction point. Its role is narrow: a test of behaviour on the first real pullback. A touch there needs to turn into a defended response — sellers absorbed, price closed back above — rather than a clean wick through and a lazy drift. Price structure and volume are the strongest confirming evidence on this chart, but neither can answer in advance whether that defence shows up.
Only after it does does 0.08696 earn attention as the next watch. The ordering matters; strength that skips the retest proves little about who intends to stay.
Beneath everything sits 0.08354, and it works on a different layer entirely. Losing it does not merely fail one retest — it removes the higher-high, higher-low read the whole move rests on. Treating a slip through 0.08597 as fatal, or a hold above 0.08354 as proof of health, collapses two roles that need to stay separate.
The counterweights are open interest and the current funding snapshot; neither confirms strength the way price and volume do. Constructive with positioning caution is the honest stance.
#Crypto #ChartAnalysis
The first is 0.08597, a local reaction point. Its role is narrow: a test of behaviour on the first real pullback. A touch there needs to turn into a defended response — sellers absorbed, price closed back above — rather than a clean wick through and a lazy drift. Price structure and volume are the strongest confirming evidence on this chart, but neither can answer in advance whether that defence shows up.
Only after it does does 0.08696 earn attention as the next watch. The ordering matters; strength that skips the retest proves little about who intends to stay.
Beneath everything sits 0.08354, and it works on a different layer entirely. Losing it does not merely fail one retest — it removes the higher-high, higher-low read the whole move rests on. Treating a slip through 0.08597 as fatal, or a hold above 0.08354 as proof of health, collapses two roles that need to stay separate.
The counterweights are open interest and the current funding snapshot; neither confirms strength the way price and volume do. Constructive with positioning caution is the honest stance.
#Crypto #ChartAnalysis