$BTC is approaching a level where the next weekly candle could tell us a lot.
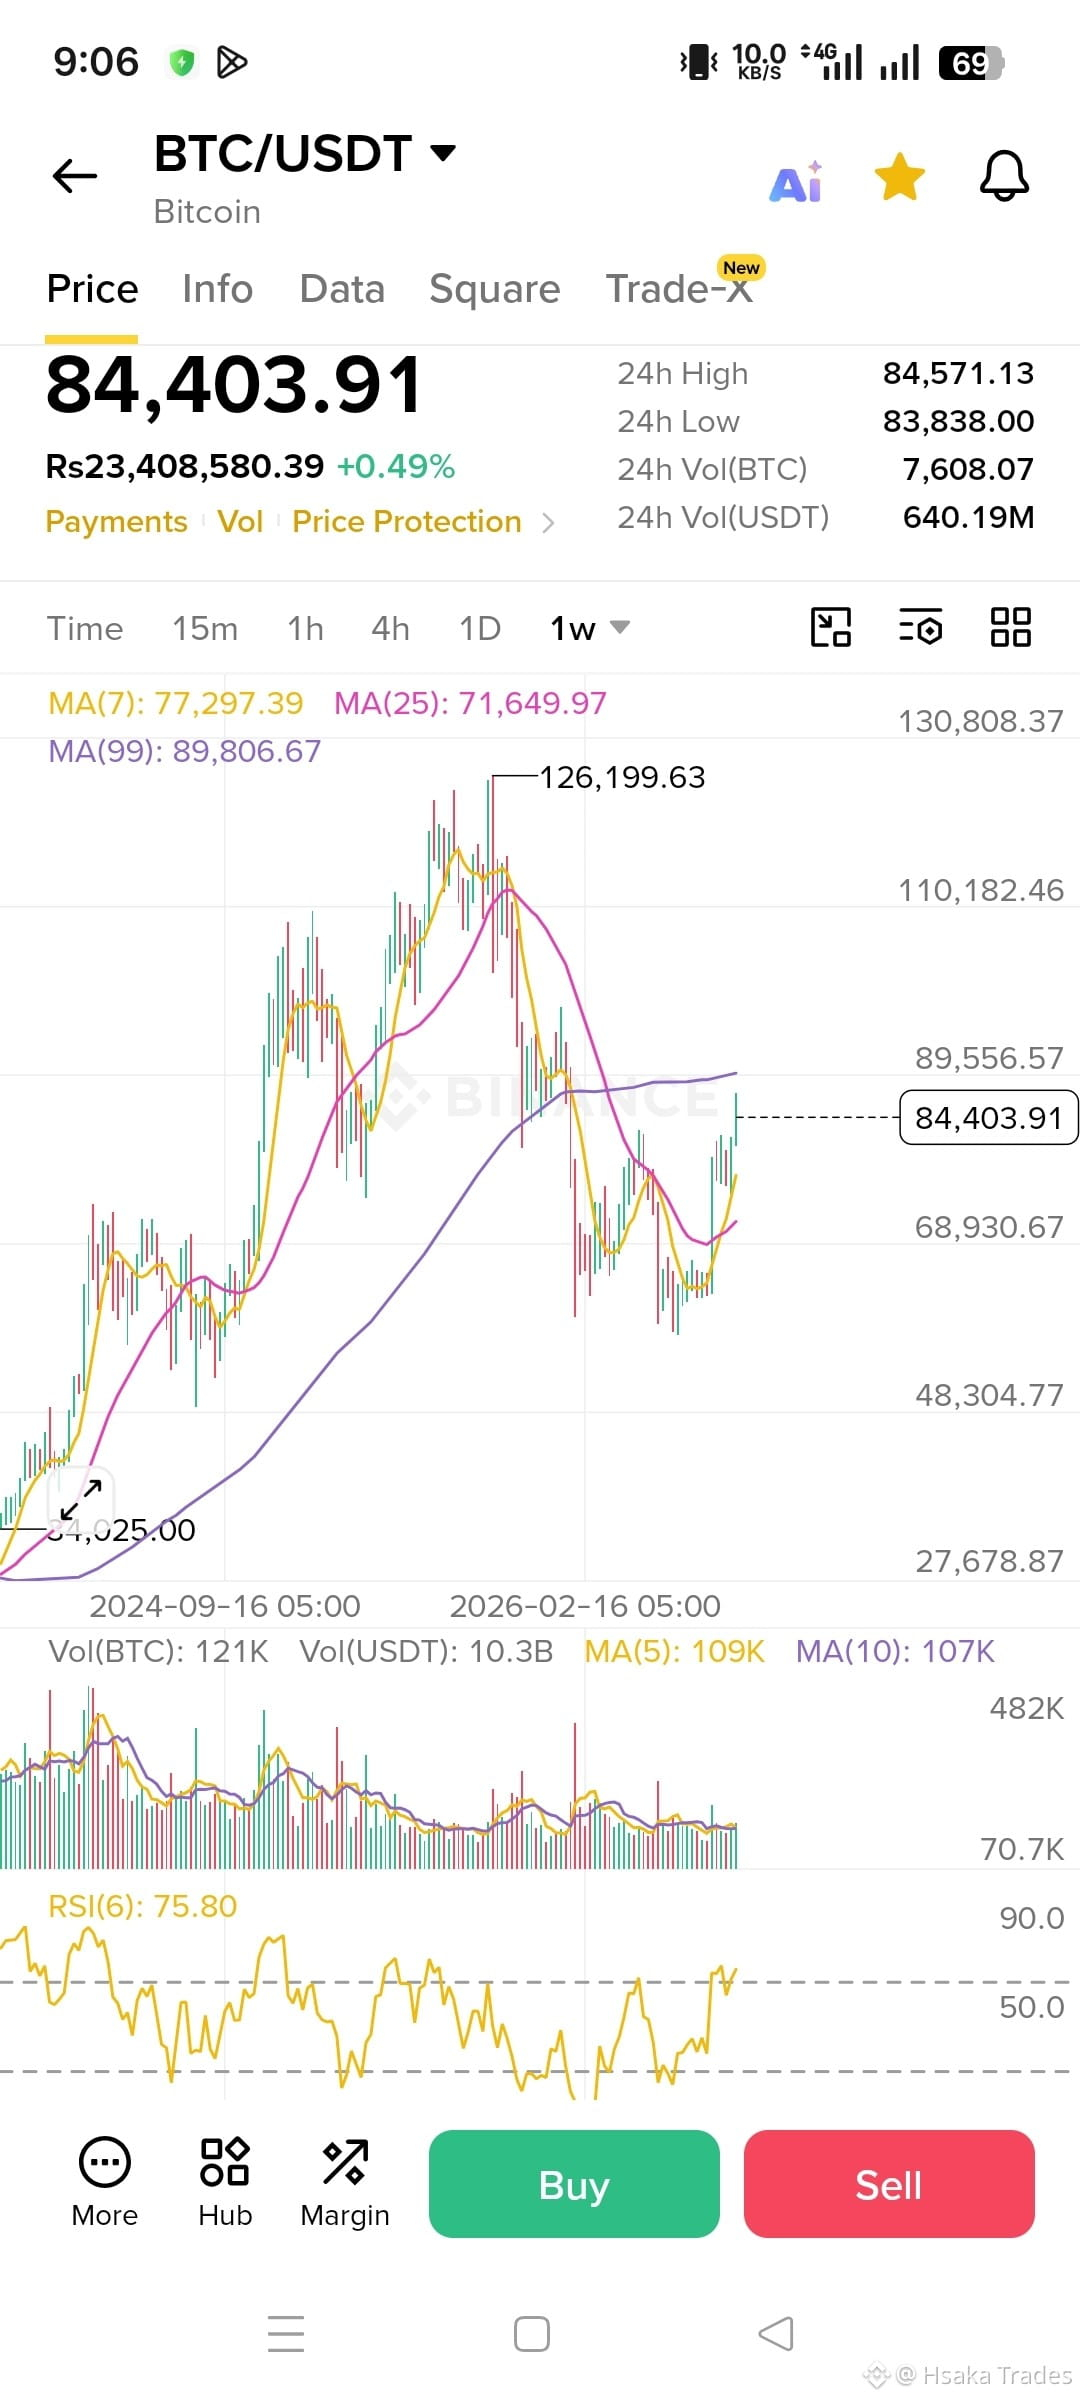
BTC is sitting around $84.4K on the weekly chart, above the MA(7) at $77.3K and MA(25) at $71.65K. That keeps the short-to-medium structure constructive, but there’s an important obstacle ahead: the MA(99) near $89.8K.
The chart also shows RSI(6) around 75.8, meaning momentum is strong but already stretched on this timeframe. Weekly volume doesn’t show a dramatic expansion either, so I’d rather see stronger participation before calling this a confirmed continuation.
For me, $89.5K–$90K is the key resistance zone. On the downside, $77K is the first area I’d watch, followed by roughly $71.6K if selling pressure increases.
Current derivatives data adds another piece: Binance BTC funding is positive while open interest is around $8B, so leveraged positioning is present, but funding is not at an extreme level.
My Take: BTC has recovered strongly, but this is where chasing becomes less attractive. I want to see how price reacts around the $89K–$90K area and whether volume confirms the move.
**Do you think BTC can break that resistance with real spot demand, or does the weekly RSI need to cool first?
#TrumpRejectsIranHormuzReopening
BTC is sitting around $84.4K on the weekly chart, above the MA(7) at $77.3K and MA(25) at $71.65K. That keeps the short-to-medium structure constructive, but there’s an important obstacle ahead: the MA(99) near $89.8K.
The chart also shows RSI(6) around 75.8, meaning momentum is strong but already stretched on this timeframe. Weekly volume doesn’t show a dramatic expansion either, so I’d rather see stronger participation before calling this a confirmed continuation.
For me, $89.5K–$90K is the key resistance zone. On the downside, $77K is the first area I’d watch, followed by roughly $71.6K if selling pressure increases.
Current derivatives data adds another piece: Binance BTC funding is positive while open interest is around $8B, so leveraged positioning is present, but funding is not at an extreme level.
My Take: BTC has recovered strongly, but this is where chasing becomes less attractive. I want to see how price reacts around the $89K–$90K area and whether volume confirms the move.
**Do you think BTC can break that resistance with real spot demand, or does the weekly RSI need to cool first?
#TrumpRejectsIranHormuzReopening