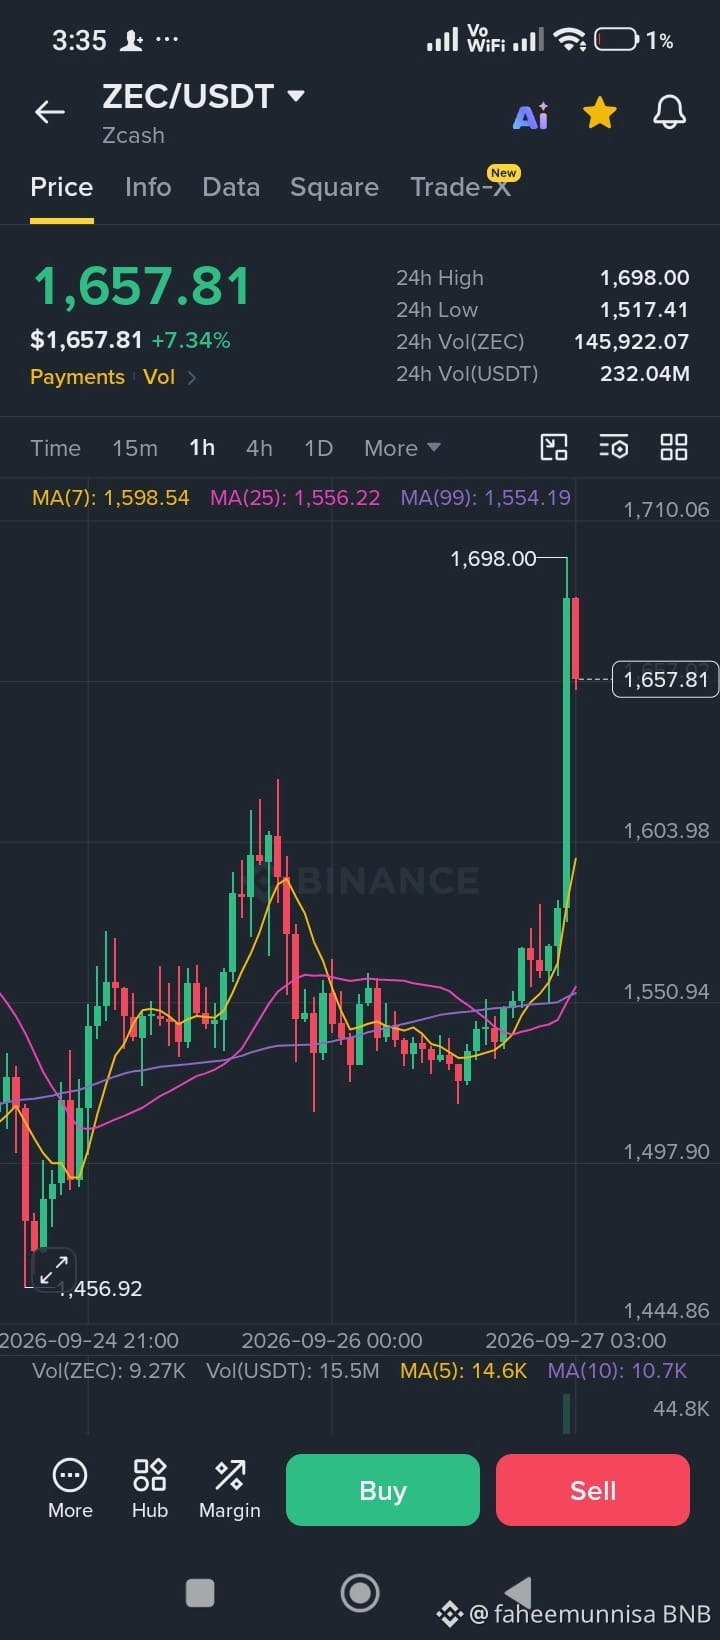
$ZEC Current Market Analysis ⚡️
ZEC/USDT — 1H Chart
$ZEC is showing strong bullish momentum, currently around $1,657.81, after a sharp breakout from the $1,550–$1,600 zone.
📊 Key Levels
🔴 Resistance: $1,698–$1,710
🟡 Near Support: $1,600–$1,603
🟢 Strong Support: $1,550–$1,556
📈 MA(7): $1,598.54
📈 MA(25): $1,556.22
📈 MA(99): $1,554.19
The price is trading above all three moving averages, while the breakout candle came with noticeably higher volume. A sustained move above $1,698 could keep momentum elevated, while rejection there may bring a pullback toward $1,600 or $1,550.
Watch the next 1H candle closely — confirmation matters after such a sharp move.
#BİNANCE #Trading #ZECUSDT
ZEC/USDT — 1H Chart
$ZEC is showing strong bullish momentum, currently around $1,657.81, after a sharp breakout from the $1,550–$1,600 zone.
📊 Key Levels
🔴 Resistance: $1,698–$1,710
🟡 Near Support: $1,600–$1,603
🟢 Strong Support: $1,550–$1,556
📈 MA(7): $1,598.54
📈 MA(25): $1,556.22
📈 MA(99): $1,554.19
The price is trading above all three moving averages, while the breakout candle came with noticeably higher volume. A sustained move above $1,698 could keep momentum elevated, while rejection there may bring a pullback toward $1,600 or $1,550.
Watch the next 1H candle closely — confirmation matters after such a sharp move.
#BİNANCE #Trading #ZECUSDT