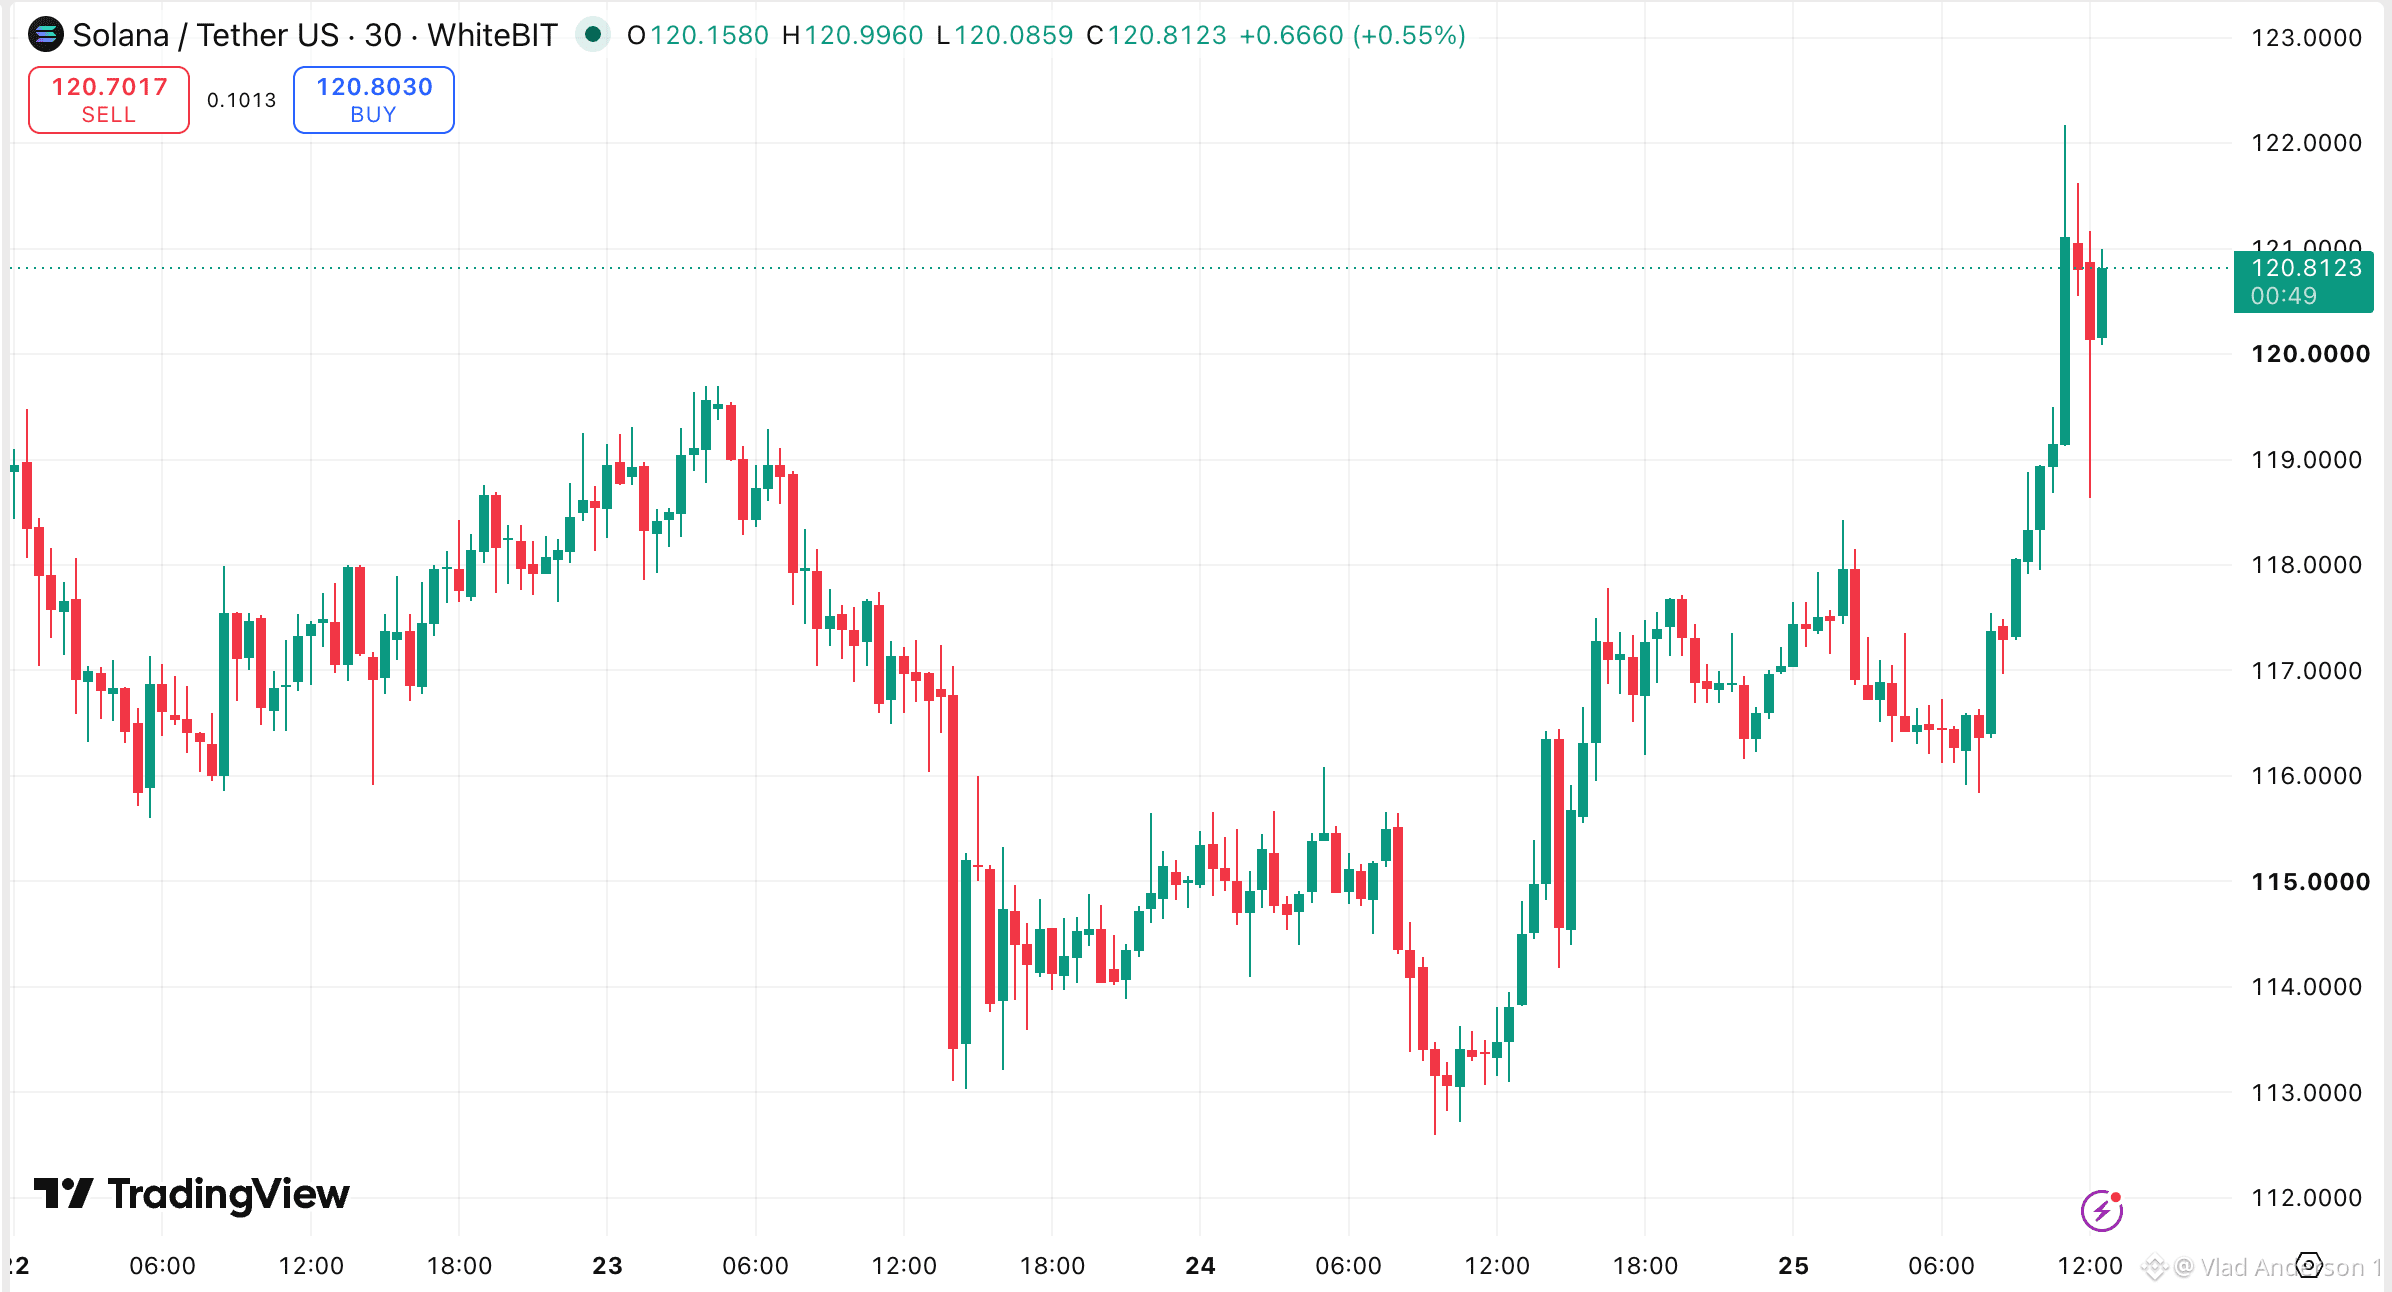
☀️ SOL at $119.5: Four Resistance Levels Packed Into $2.60 👀 $SOL is stuck right under $120, and the chart above it is crowded: 🟡 $120.00 → psychological level 🟡 $120.59 → hourly resistance 🟠 $121.98 → upper daily Bollinger Band 🔴 $122.61 → daily R1 Four levels in a $2.60 range. Breaking one means little. A daily close above $122.61 means a lot. Below: 🟢 $119.23 → daily pivot, price is sitting right on it 🟢 $116.14 → daily S1 🔵 $107.06 → Bollinger mid-band, the deeper pullback target The part most people miss: daily ATR is $5.50. R1 (+2.6%) and S1 (-2.8%) both sit inside one normal day of movement. A wick to $122 or $116 proves nothing, that's regular SOL noise 😅 The close is what counts. How I read it: daily close above $122.61 → continuation confirmed. Lose $116 → $107 comes into view. #BTC Price Analysis# #Bitcoin Price Prediction: What is Bitcoins next move?#


投稿