

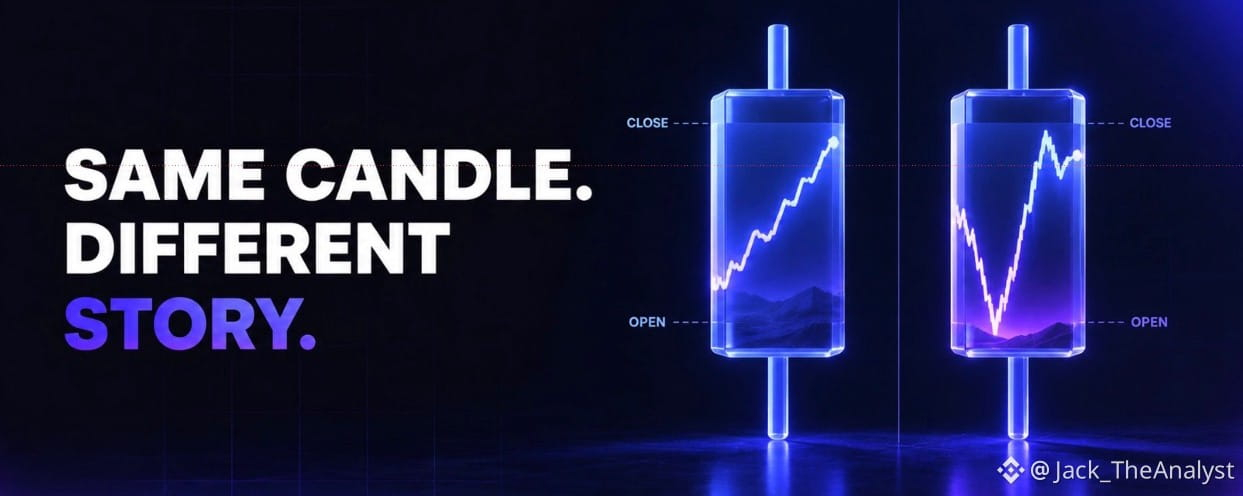

Higher-timeframe candles are useful because they compress a large amount of price action into something easy to read. The problem is that two candles with almost identical opens, highs, lows and closes can be created through very different sequences of events.
That sequence can matter when evaluating what actually happened during the session.
Suppose BTC opens at $80,000 and closesat $82,000. In the first scenario, price gradually moves higher throughout the day, pullbacks remain shallow, and most of the final hours are spent near $82,000. Buyers gained ground and were able to maintain it.
Now imagine the same open and close, but BTC first drops to $77,500, aggressively recovers to $83,000 and then falls back to $82,000 before the daily close.
Both sessions finish bullish, but they tell different stories. The second contained a failed move lower, a strong recovery and then selling above the eventual closing price. None of that is fully explained by simply calling the daily candle bullish.
This becomes especially useful around important levels.
Imagine a daily candle closes slightly above resistance. Looking only at the daily chart, it may appear to be a successful breakout. But a lower timeframe might show that price broke resistance early, spent most of the session back below it and only recovered during the final hour.
Compare that with a session that breaks resistance early, retests it from above and spends the remainder of the day building higher. The daily candles could eventually look similar, but the second shows much clearer acceptance above the level.
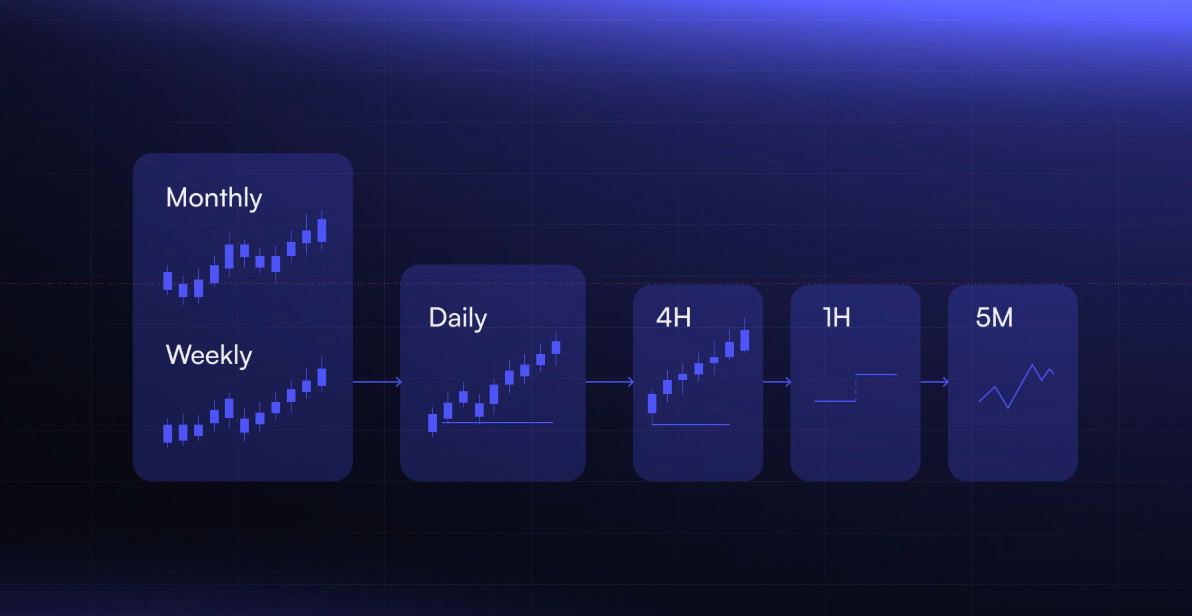
Lower timeframes can therefore be used as a diagnostic tool rather than simply as another place to search for entries.
When a higher-timeframe candle forms at an important area, look inside it and ask a few basic questions. Which side moved first? Was that move sustained or rejected? Where did price spend most of the session? Did the close confirm the dominant behavior of the day, or did a late move dramatically change the final candle?
You do not need to dissect every daily candle.
Most of the time, the higher timeframe provides enough information on its own.
But around major breakouts, failed moves and turning points, understanding how the candle was built can reveal information that its final shape compresses away.
The candle shows the result.
Sometimes the sequence explains how meaningful that result actually was.
#BTC走势分析 $BTC #PolymarketBankFailureBetsDrawFDICConcern #BlackRockBuildsTokenizedPortfoliosForOndo
