🚨 META Faces Profit-Taking After a Powerful Rally — Is $800 Next?
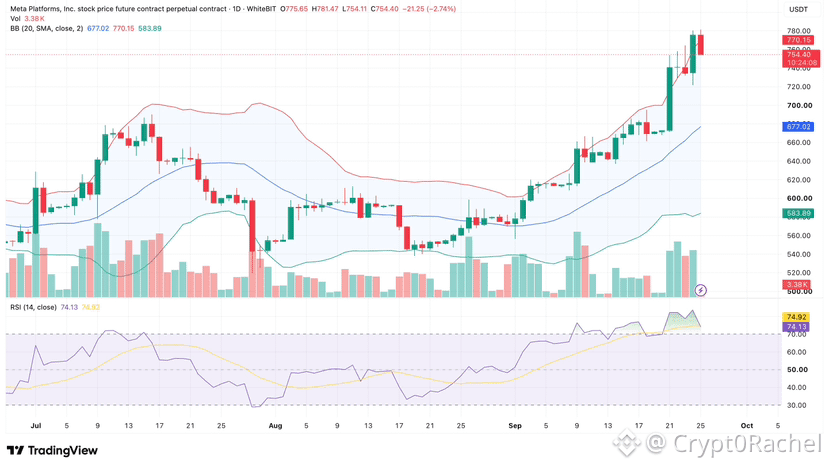
Meta Platforms ($META) has been showing strong bullish momentum, with price climbing from the $600–$670 zone to a recent high near $781.
But after this impressive rally, the daily chart is flashing some signals traders should keep an eye on. 👀
📊 Key Technical Levels (1D)
At the time of the chart snapshot:
Current price: $754.40
Recent high: $781.47
Bollinger Bands upper: $770.15
Bollinger Bands middle (20-day SMA): $677.02
Bollinger Bands lower: $583.89
RSI (14): 74.13
🔥 1. Bulls Still Have the Momentum
META has broken above its previous consolidation zone around $670–$700, with strong bullish candles indicating increased buying pressure.
Price remains well above the 20-day SMA at $677.02, keeping the broader daily trend bullish for now.
⚠️ 2. RSI Signals an Overbought Market
The daily RSI is sitting around 74, above the traditional 70 overbought threshold.
This doesn't automatically mean a reversal is coming, but it does suggest the rally may be stretched in the short term.
A period of consolidation or a healthy pullback would not be surprising after such a strong move.
🎯 3. Important Levels to Watch
Resistance:
$770–$781: Immediate resistance and recent high zone.
$800: Psychological level and potential upside target if buyers reclaim momentum.
Support:
$740–$750: Near-term price support zone.
$720–$730: Potential pullback area.
$677: Daily middle Bollinger Band and a key technical reference.
📈 My Outlook
As long as META holds above its recent breakout zones, the bullish structure remains intact.
A clean breakout above $781 could open the door toward the $800 psychological level. However, failure to reclaim the upper Bollinger Band, combined with the elevated RSI, could bring further profit-taking.
Personally, I would watch for confirmation rather than chase the move after such a strong rally.
Do you think META can break $800 next, or are we heading for a deeper retracement first? Drop your thoughts below! 👇
#meta #BinanceSquare #Write2Earn
Meta Platforms ($META) has been showing strong bullish momentum, with price climbing from the $600–$670 zone to a recent high near $781.
But after this impressive rally, the daily chart is flashing some signals traders should keep an eye on. 👀
📊 Key Technical Levels (1D)
At the time of the chart snapshot:
Current price: $754.40
Recent high: $781.47
Bollinger Bands upper: $770.15
Bollinger Bands middle (20-day SMA): $677.02
Bollinger Bands lower: $583.89
RSI (14): 74.13
🔥 1. Bulls Still Have the Momentum
META has broken above its previous consolidation zone around $670–$700, with strong bullish candles indicating increased buying pressure.
Price remains well above the 20-day SMA at $677.02, keeping the broader daily trend bullish for now.
⚠️ 2. RSI Signals an Overbought Market
The daily RSI is sitting around 74, above the traditional 70 overbought threshold.
This doesn't automatically mean a reversal is coming, but it does suggest the rally may be stretched in the short term.
A period of consolidation or a healthy pullback would not be surprising after such a strong move.
🎯 3. Important Levels to Watch
Resistance:
$770–$781: Immediate resistance and recent high zone.
$800: Psychological level and potential upside target if buyers reclaim momentum.
Support:
$740–$750: Near-term price support zone.
$720–$730: Potential pullback area.
$677: Daily middle Bollinger Band and a key technical reference.
📈 My Outlook
As long as META holds above its recent breakout zones, the bullish structure remains intact.
A clean breakout above $781 could open the door toward the $800 psychological level. However, failure to reclaim the upper Bollinger Band, combined with the elevated RSI, could bring further profit-taking.
Personally, I would watch for confirmation rather than chase the move after such a strong rally.
Do you think META can break $800 next, or are we heading for a deeper retracement first? Drop your thoughts below! 👇
#meta #BinanceSquare #Write2Earn