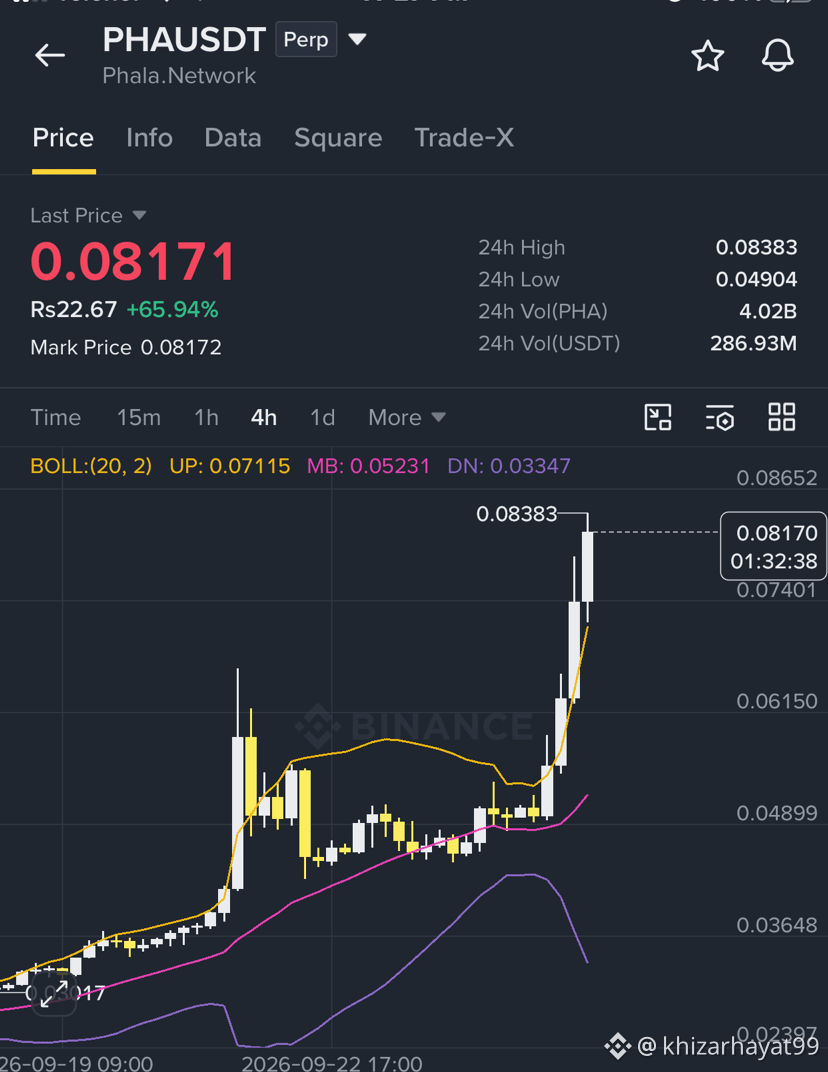
$PHA If you are evaluating PHA/USDT around the 0.082 USDT price region, you are looking at a key structural breakout and resistance zone.
Key Technical Levels around $0.082
Immediate Resistance Zone ($0.082 – $0.085): $0.082 acts as a psychological and multi-touch horizontal supply level. Reclaiming and holding above this level on a 4H or Daily candle close signals strong bullish expansion.
Support / Demand Zone ($0.072 – $0.076): If rejected at $0.082, expect a liquidity sweep down into this consolidation block before any secondary attempt.
Breakout Targets ($0.095 / $0.115): A clean push past $0.085 opens upside room toward liquidity resting around previous swing highs ($0.095+).
Recommended Trading Setup
Setup A: Bullish Break-and-Retest (High Probability)
Trigger: Wait for a 4H candle close above 0.0825 USDT on above-average volume.
Entry Zone: Limit entry on the retest of 0.0805 – 0.0820 USDT.
Stop-Loss (SL): Below the retest swing low around 0.0760 USDT (or 0.0740 for lower leverage).
Take-Profit (TP):
TP1: 0.0920 USDT (Scale out 40-50%, move SL to entry)
TradingView
TP2: 0.1040 USDT
TP3: 0.1180 USDT (Runner)
Setup B: Dip Buy at Support (Better Risk/Reward)
Trigger: Rejection at 0.082 leads to a controlled pullback into the support block.
Entry Zone: 0.0730 – 0.0755 USDT.
Stop-Loss (SL): Below 0.0695 USDT.
Take-Profit (TP):
TP1: 0.0820 USDT (Current level test)
TP2: 0.0950 USDT
Technical Indicators to Add
20 & 50 EMA (4H Timeframe): Verify if the 20 EMA is crossing above the 50 EMA below price to confirm trend momentum.
Volume Delta / OBV: Ensure higher volume accompanies any break over $0.082; low-volume breaks around this level frequently result in fakeouts.
RSI (14): Check for overbought conditions on lower timeframes (15m–1h) to avoid buying directly into peak momentum before a pullback.
Would you like a risk-management calculation based on your leverage and account size?
Key Technical Levels around $0.082
Immediate Resistance Zone ($0.082 – $0.085): $0.082 acts as a psychological and multi-touch horizontal supply level. Reclaiming and holding above this level on a 4H or Daily candle close signals strong bullish expansion.
Support / Demand Zone ($0.072 – $0.076): If rejected at $0.082, expect a liquidity sweep down into this consolidation block before any secondary attempt.
Breakout Targets ($0.095 / $0.115): A clean push past $0.085 opens upside room toward liquidity resting around previous swing highs ($0.095+).
Recommended Trading Setup
Setup A: Bullish Break-and-Retest (High Probability)
Trigger: Wait for a 4H candle close above 0.0825 USDT on above-average volume.
Entry Zone: Limit entry on the retest of 0.0805 – 0.0820 USDT.
Stop-Loss (SL): Below the retest swing low around 0.0760 USDT (or 0.0740 for lower leverage).
Take-Profit (TP):
TP1: 0.0920 USDT (Scale out 40-50%, move SL to entry)
TradingView
TP2: 0.1040 USDT
TP3: 0.1180 USDT (Runner)
Setup B: Dip Buy at Support (Better Risk/Reward)
Trigger: Rejection at 0.082 leads to a controlled pullback into the support block.
Entry Zone: 0.0730 – 0.0755 USDT.
Stop-Loss (SL): Below 0.0695 USDT.
Take-Profit (TP):
TP1: 0.0820 USDT (Current level test)
TP2: 0.0950 USDT
Technical Indicators to Add
20 & 50 EMA (4H Timeframe): Verify if the 20 EMA is crossing above the 50 EMA below price to confirm trend momentum.
Volume Delta / OBV: Ensure higher volume accompanies any break over $0.082; low-volume breaks around this level frequently result in fakeouts.
RSI (14): Check for overbought conditions on lower timeframes (15m–1h) to avoid buying directly into peak momentum before a pullback.
Would you like a risk-management calculation based on your leverage and account size?