🚨 WAIT… $FET IS STARTING TO LOOK VERY DIFFERENT 👀
FET/USDT has been building a strong recovery structure after the long decline.
The interesting part?
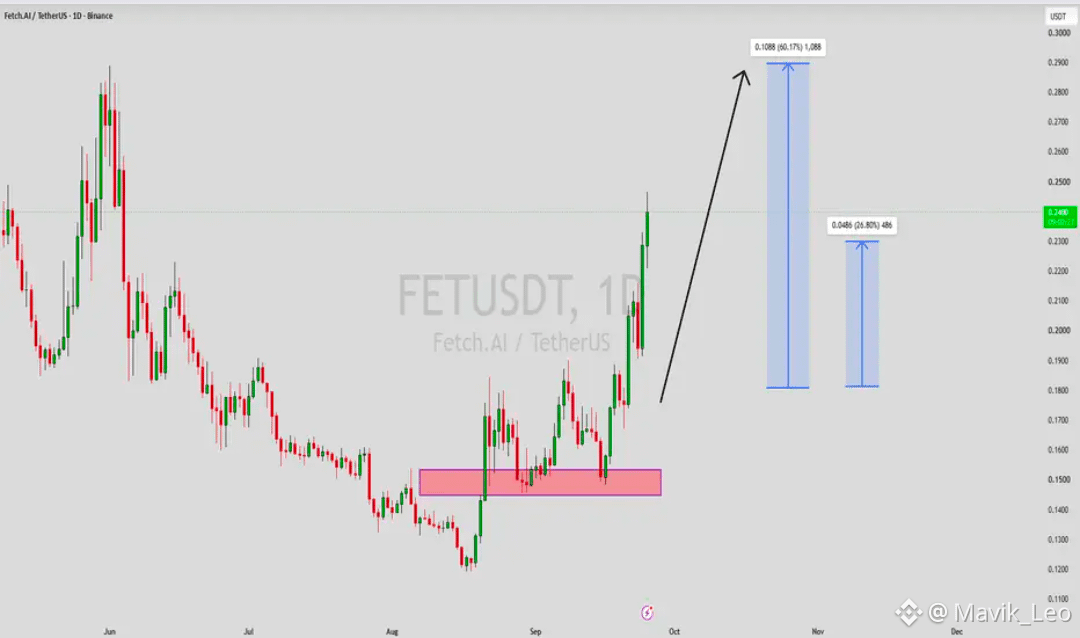
Price defended the 0.145–0.155 demand zone multiple times, while buyers continued pushing the market toward the breakout area.
Now momentum is expanding. 🔥
If FET gets a clean breakout with sustained volume, the next major zones on this setup are:
🎯 0.210
🎯 0.290
That represents roughly 50–60% upside from the lower breakout structure shown on the chart.
But I’m not chasing the move blindly.
Breakout + volume confirmation = bullish continuation.
Weak breakout = possible rejection.
The key question now:
Is FET finally transitioning from accumulation into a new expansion phase? 👀📈$QI $PHA
FET/USDT has been building a strong recovery structure after the long decline.
The interesting part?
Price defended the 0.145–0.155 demand zone multiple times, while buyers continued pushing the market toward the breakout area.
Now momentum is expanding. 🔥
If FET gets a clean breakout with sustained volume, the next major zones on this setup are:
🎯 0.210
🎯 0.290
That represents roughly 50–60% upside from the lower breakout structure shown on the chart.
But I’m not chasing the move blindly.
Breakout + volume confirmation = bullish continuation.
Weak breakout = possible rejection.
The key question now:
Is FET finally transitioning from accumulation into a new expansion phase? 👀📈$QI $PHA