⚽ AC Milan Fan Token (ACM/USDT) – Market Analysis
ACM (AC Milan Fan Token) is a fan-focused crypto asset designed to connect AC Milan supporters with digital engagement, rewards, and club-related experiences.
📊 Technical Outlook
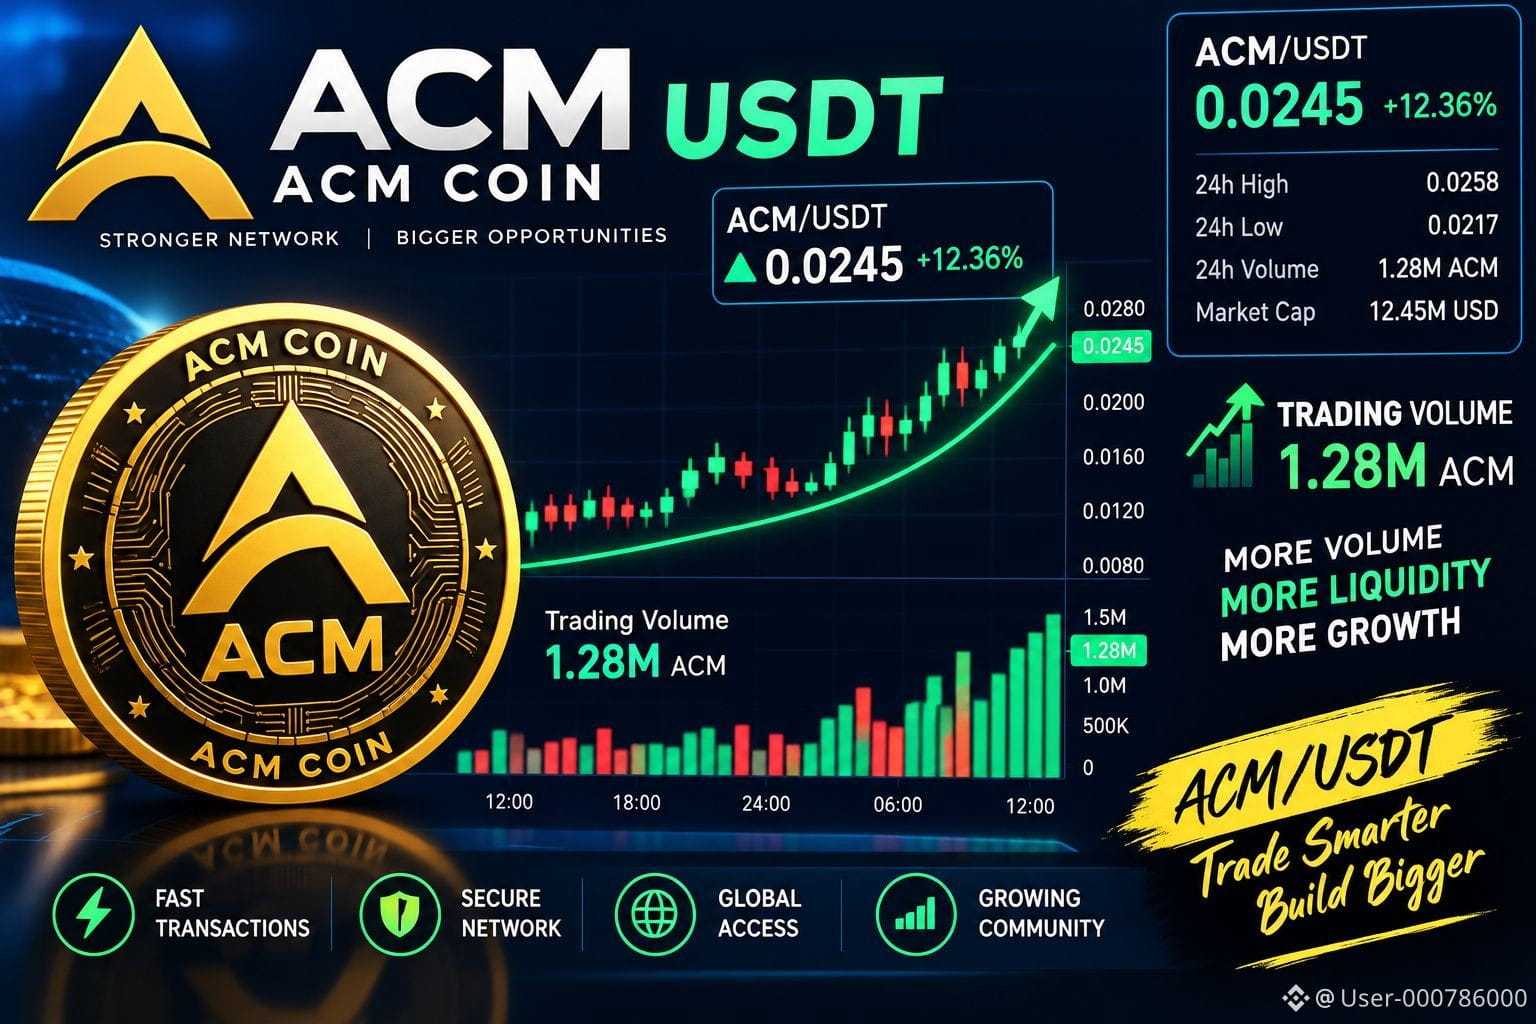
ACM/USDT should be monitored closely for changes in trading volume and market structure. A sustained move above a key resistance level, supported by increasing volume, can indicate stronger buying interest. Conversely, rejection from resistance followed by declining volume may increase the possibility of a pullback toward previous support areas.
🔹 Bullish Scenario
If ACM breaks resistance with strong volume and maintains higher highs and higher lows, traders may look for continuation toward the next resistance zones.
🔸 Bearish Scenario
If price fails to hold an important support level and selling volume increases, ACM could experience further downside before attempting another recovery.
📈 Key Trading Indicators
• Price action & market structure
• Support and resistance
• 24H trading volume
• Volume confirmation on breakouts
• RSI and moving averages
• Bitcoin/overall crypto-market direction
⚠️ Risk Management
ACM can be highly volatile, particularly during periods of low liquidity or strong market-wide movements. Always confirm a breakout with volume and use appropriate position sizing and stop-loss levels rather than relying on a price prediction.
ACM/USDT is a token to watch for volume expansion and confirmed breakouts.
This is market analysis for educational purposes, not financial advice. Always verify the live ACM/USDT price and volume before making a trading decision.#ACM.智能策略库🥇🥇 #ACMilanFanToken #acmilan #BinanceWillListHyperliquid(HYPE) #CFTCUpdatesGuidanceOnTokenizedAssets
ACM (AC Milan Fan Token) is a fan-focused crypto asset designed to connect AC Milan supporters with digital engagement, rewards, and club-related experiences.
📊 Technical Outlook
ACM/USDT should be monitored closely for changes in trading volume and market structure. A sustained move above a key resistance level, supported by increasing volume, can indicate stronger buying interest. Conversely, rejection from resistance followed by declining volume may increase the possibility of a pullback toward previous support areas.
🔹 Bullish Scenario
If ACM breaks resistance with strong volume and maintains higher highs and higher lows, traders may look for continuation toward the next resistance zones.
🔸 Bearish Scenario
If price fails to hold an important support level and selling volume increases, ACM could experience further downside before attempting another recovery.
📈 Key Trading Indicators
• Price action & market structure
• Support and resistance
• 24H trading volume
• Volume confirmation on breakouts
• RSI and moving averages
• Bitcoin/overall crypto-market direction
⚠️ Risk Management
ACM can be highly volatile, particularly during periods of low liquidity or strong market-wide movements. Always confirm a breakout with volume and use appropriate position sizing and stop-loss levels rather than relying on a price prediction.
ACM/USDT is a token to watch for volume expansion and confirmed breakouts.
This is market analysis for educational purposes, not financial advice. Always verify the live ACM/USDT price and volume before making a trading decision.#ACM.智能策略库🥇🥇 #ACMilanFanToken #acmilan #BinanceWillListHyperliquid(HYPE) #CFTCUpdatesGuidanceOnTokenizedAssets