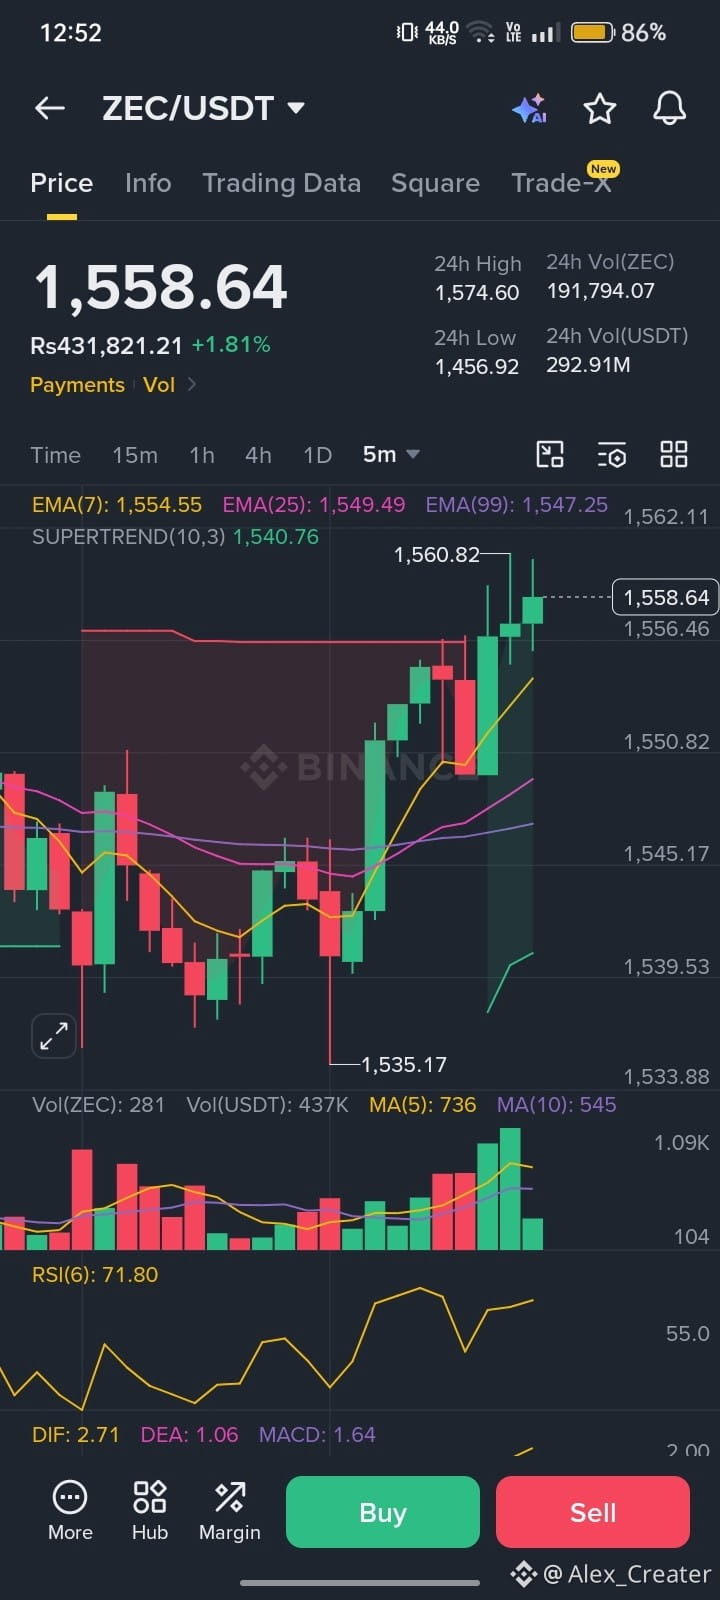
$ZEC /USDT — 5M Chart Analysis
🟢 Bullish Momentum: ZEC is trading around 1,558.64, with price above EMA 7, 25 & 99.
📈 Trend: Supertrend remains bullish at 1,540.76.
🔥 Momentum: MACD is positive, while RSI at 71.8 shows strong buying pressure but also an overbought zone.
Key Levels:
🎯 Resistance: 1,560.82 → 1,574.60
🛡️ Support: 1,554.55 → 1,549.49 → 1,540.76
Bullish Scenario: A clean breakout and hold above 1,560.82 could open the way toward 1,574.60.
⚠️ If price rejects resistance, a pullback toward 1,549–1,540 is possible.
ZEC is showing strong momentum — watch the breakout zone closely! 🚀📊
#ZEC #ZECUSDT #Crypto #Trading
#TechnicalAnalysis #Binance
$ZEC $ONDO
🟢 Bullish Momentum: ZEC is trading around 1,558.64, with price above EMA 7, 25 & 99.
📈 Trend: Supertrend remains bullish at 1,540.76.
🔥 Momentum: MACD is positive, while RSI at 71.8 shows strong buying pressure but also an overbought zone.
Key Levels:
🎯 Resistance: 1,560.82 → 1,574.60
🛡️ Support: 1,554.55 → 1,549.49 → 1,540.76
Bullish Scenario: A clean breakout and hold above 1,560.82 could open the way toward 1,574.60.
⚠️ If price rejects resistance, a pullback toward 1,549–1,540 is possible.
ZEC is showing strong momentum — watch the breakout zone closely! 🚀📊
#ZEC #ZECUSDT #Crypto #Trading
#TechnicalAnalysis #Binance
$ZEC $ONDO