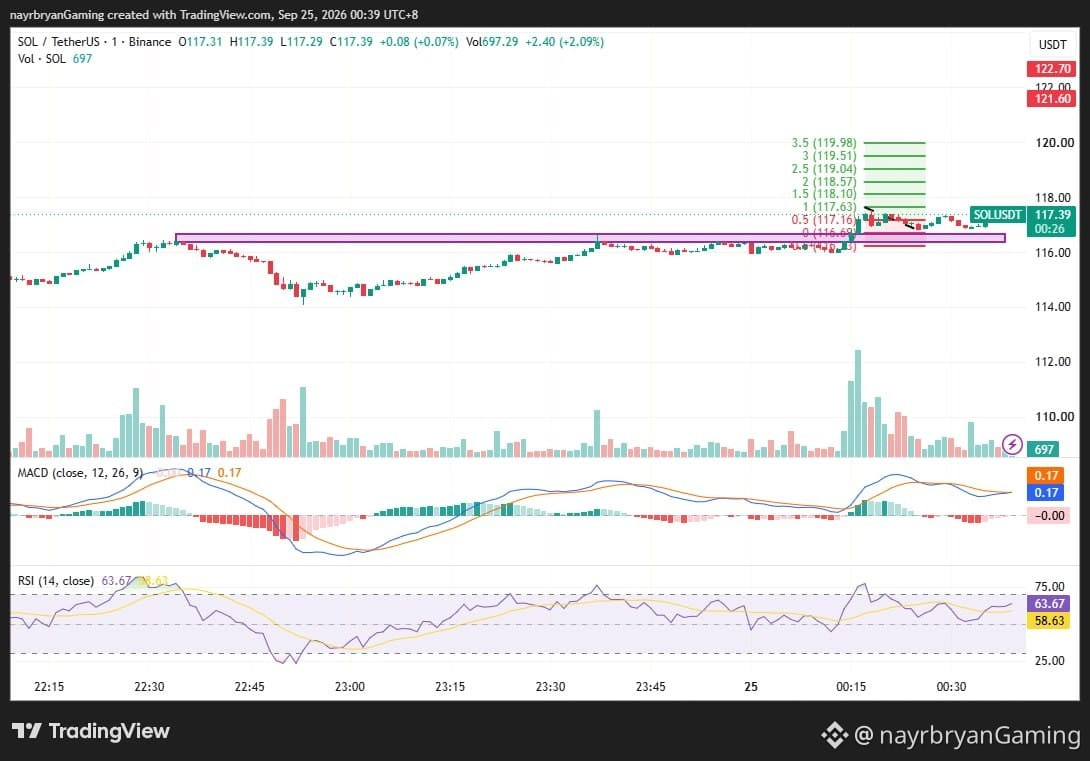
LIGHT ANALYSIS / CHART SETUP — SOL/USDT
📈 Structure Overview
Market phase: Ascending channel → Breakout → Consolidation
Channel structure: Higher lows + rising support
Key reaction area: 116.86 – 117.16
Immediate resistance: 117.77
Major upside levels: 118.10 → 118.57 → 119.04 → 119.51 → 119.98
Invalidation: 116.46
📌 What I’m Watching
Scenario A — Bullish Continuation
If SOL holds above 117.16, price may rotate toward:
117.77 → 118.10 → 118.57 → 119.04 → 119.51 → 119.98
These levels correspond with the Fibonacci extensions marked on the chart.
Scenario B — Failed Breakout
If SOL falls back below 116.86, the breakout structure becomes weaker.
A deeper move below 116.46 would invalidate the current bullish continuation framework and bring the lower channel structure into focus.
📊 Indicator Check
MACD: Positive → bullish momentum remains
RSI: 64.80 → strong momentum, below the 75 upper boundary
Price Structure: Ascending channel + recent breakout
Key Confirmation: 117.16 hold / 116.46 invalidation
Note: This is a chart framework, not a trade recommendation. Use it to support your own DYOR-based execution plan.
— @nayrbryanGaming #SOLAnalysis #ChartSetup #PriceAction #SmartMoney #Fibonacci #CryptoTrading #DYOR #NFA
📈 Structure Overview
Market phase: Ascending channel → Breakout → Consolidation
Channel structure: Higher lows + rising support
Key reaction area: 116.86 – 117.16
Immediate resistance: 117.77
Major upside levels: 118.10 → 118.57 → 119.04 → 119.51 → 119.98
Invalidation: 116.46
📌 What I’m Watching
Scenario A — Bullish Continuation
If SOL holds above 117.16, price may rotate toward:
117.77 → 118.10 → 118.57 → 119.04 → 119.51 → 119.98
These levels correspond with the Fibonacci extensions marked on the chart.
Scenario B — Failed Breakout
If SOL falls back below 116.86, the breakout structure becomes weaker.
A deeper move below 116.46 would invalidate the current bullish continuation framework and bring the lower channel structure into focus.
📊 Indicator Check
MACD: Positive → bullish momentum remains
RSI: 64.80 → strong momentum, below the 75 upper boundary
Price Structure: Ascending channel + recent breakout
Key Confirmation: 117.16 hold / 116.46 invalidation
Note: This is a chart framework, not a trade recommendation. Use it to support your own DYOR-based execution plan.
— @nayrbryanGaming #SOLAnalysis #ChartSetup #PriceAction #SmartMoney #Fibonacci #CryptoTrading #DYOR #NFA