

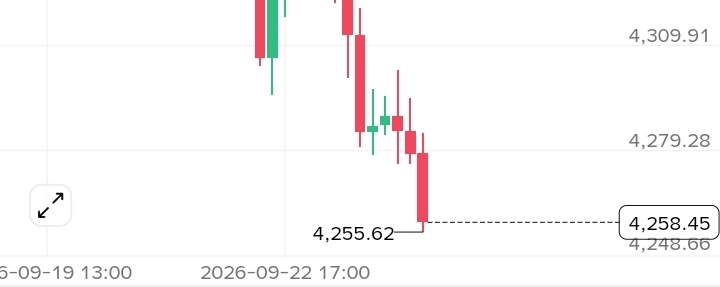

Gold is currently showing strong bearish momentum, with $XAUT /USDT trading around $4,258 on the 4H chart.
The recent decline is being driven by a combination of U.S. dollar strength, higher Treasury yields, and changing expectations around Federal Reserve interest rates.
📉 What the Chart Is Telling Us
The 4H structure is clearly showing a sequence of lower highs and lower lows, indicating that sellers currently have control.
Gold has now approached the $4,255–$4,250 area, which is an important short-term level to watch.
If buyers defend this area and a strong bullish candle appears, we could see a reaction upward.
However, if price breaks and closes below the support, further downside could follow.
⚠️ Don't Chase the Move
A strong bearish candle does not automatically mean it's time to sell. The key is to wait for confirmation and a clear setup.
I'll be watching the next 4H candles closely.
Support: $4,255–$4,250
Trend: Bearish 📉
Key factor: Confirmation
Stay patient. The next move matters more than the current candle. 👀