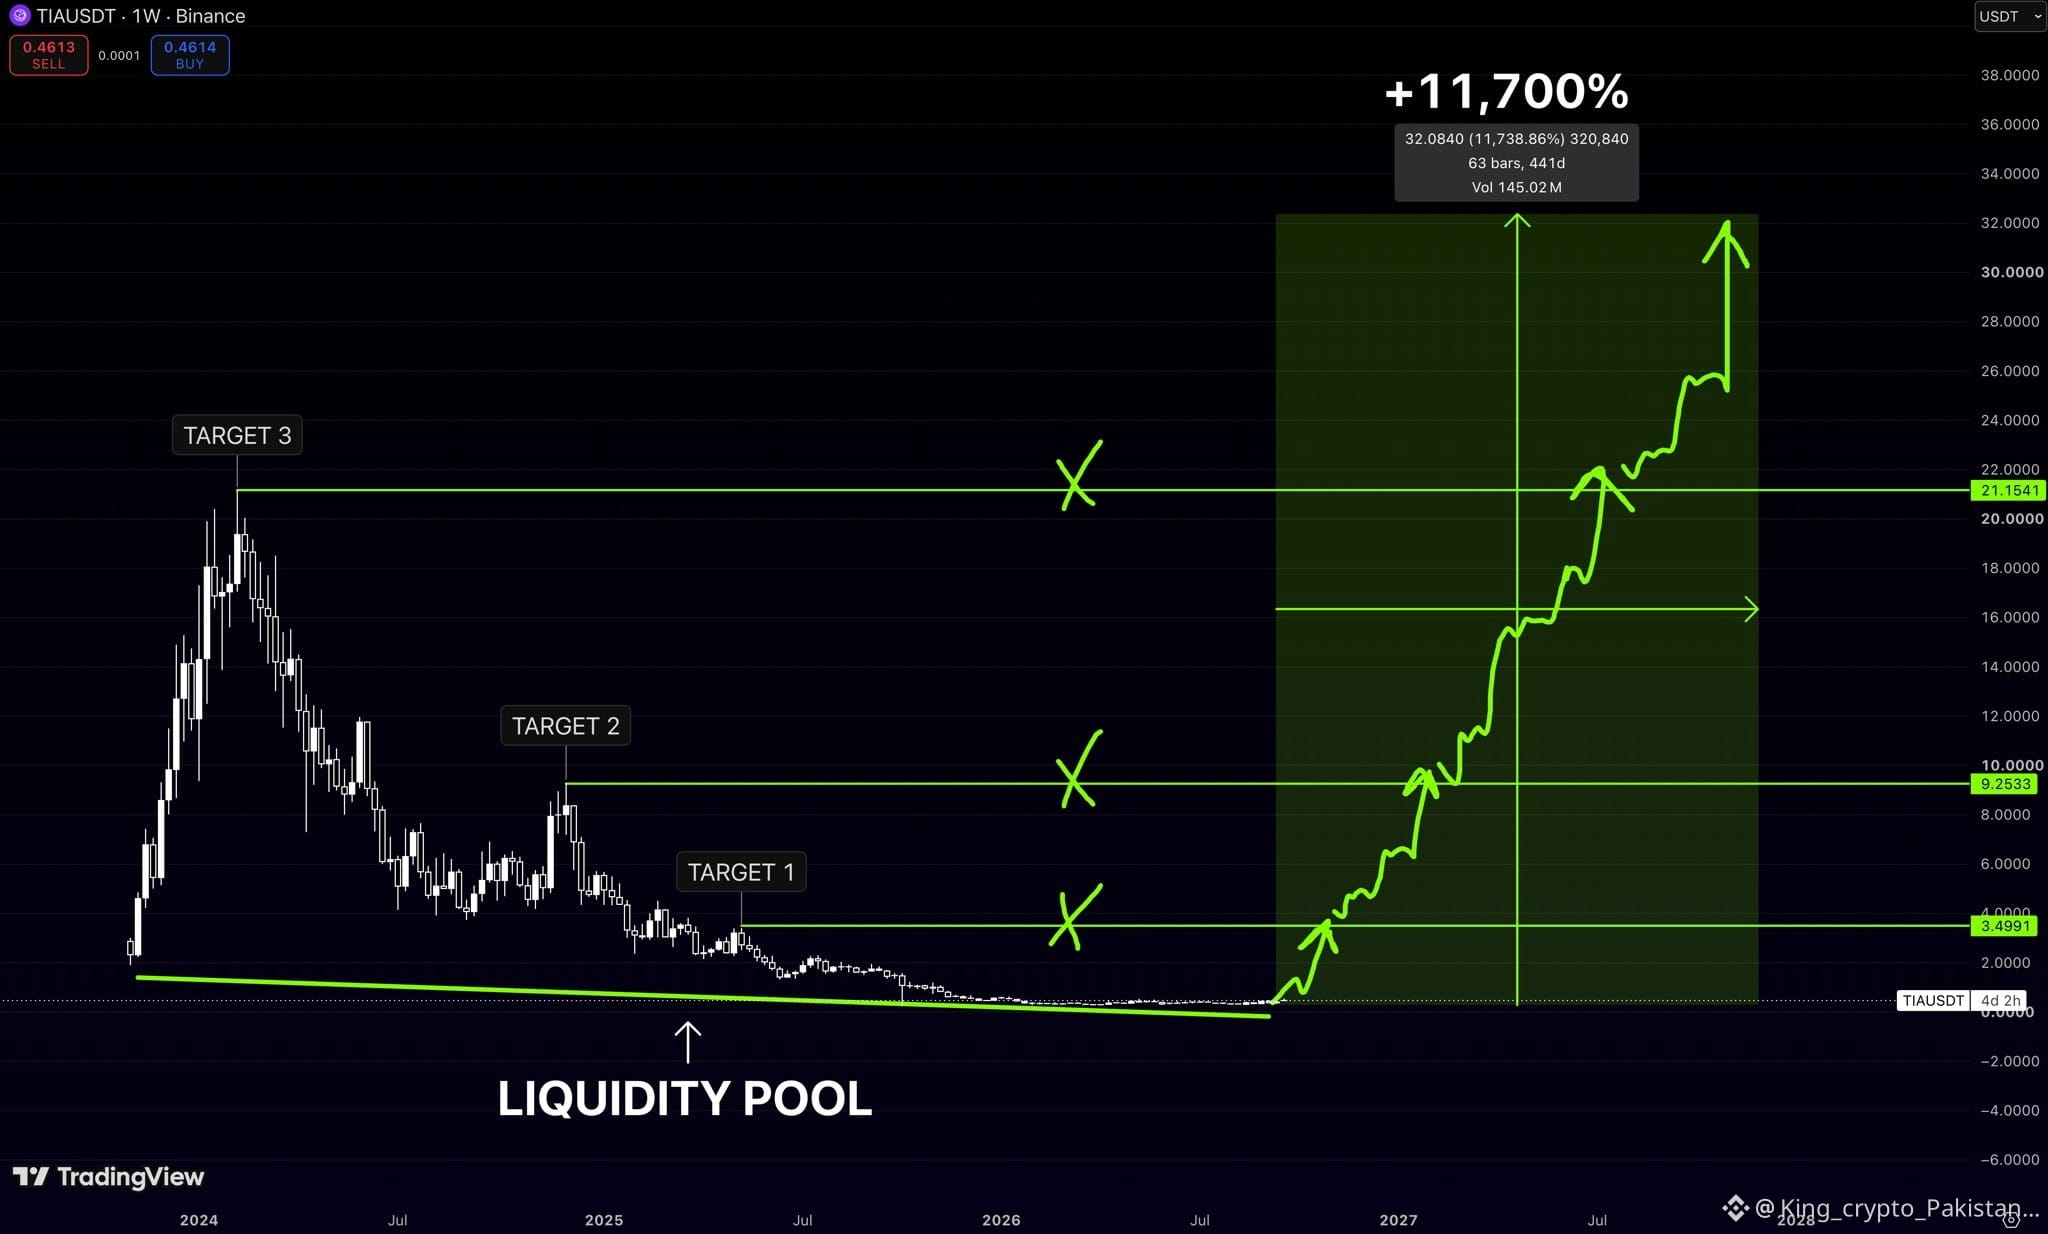
$TIA is basically trading like the market already buried it.
From $21+ all the way down to around $0.46.
That’s exactly why this chart is interesting.
There’s a massive liquidity pool sitting at the lows
while the old structure leaves three obvious levels above:
$3.50 → $9.25 → $21.15
If $TIA ever goes through a full-cycle reversal
my chart has the expansion stretching toward $32.
That’s roughly +11,700% from the bottom.
Sounds completely insane.
But crypto usually looks the most insane right before everyone starts pretending it was obvious.
From $21+ all the way down to around $0.46.
That’s exactly why this chart is interesting.
There’s a massive liquidity pool sitting at the lows
while the old structure leaves three obvious levels above:
$3.50 → $9.25 → $21.15
If $TIA ever goes through a full-cycle reversal
my chart has the expansion stretching toward $32.
That’s roughly +11,700% from the bottom.
Sounds completely insane.
But crypto usually looks the most insane right before everyone starts pretending it was obvious.