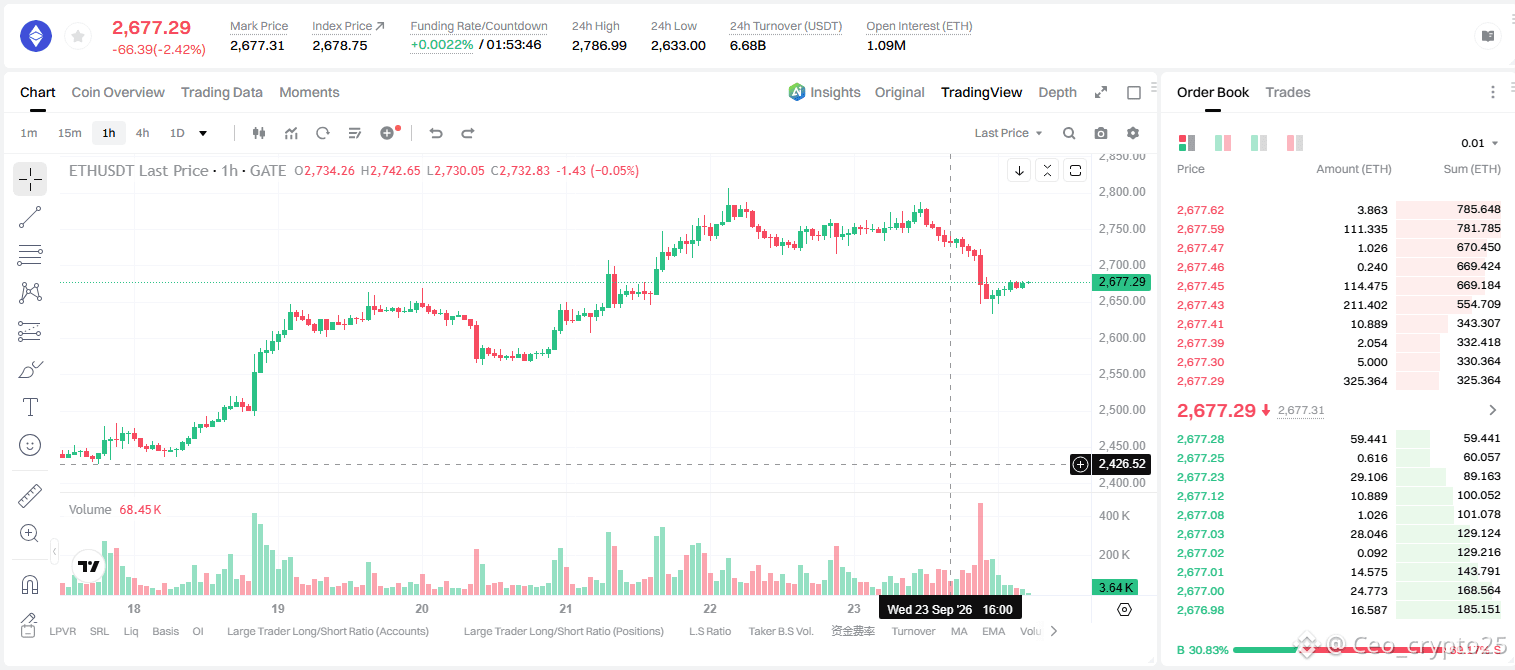
$ETH OVERSOLD BOUNCE OFF SUPPORT, EARLY RECOVERY SIGNS
$ETH USDT
LONG
Leverage: 7x
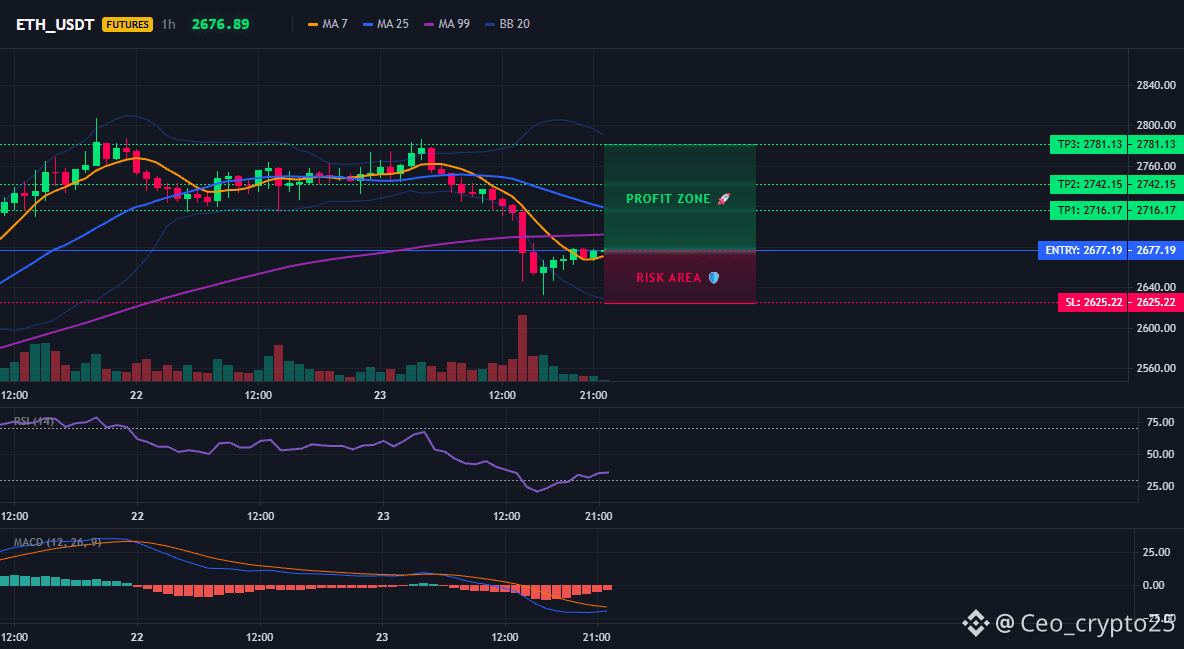
Entry Zone: 2,670 – 2,680
TP1: 2,716.17 +13%
TP2: 2,742.15 +21%
TP3: 2,781.13 +34%
Stop Loss: 2,625.22
Chart Structure:
• Sharp decline from ~2,800 down through the MA99 (purple) support line, with a hard sell-off candle piercing well below into the 2,620s before bouncing
• Price has since reclaimed ground and is now consolidating right around MA7/MA25, sitting just above the broken MA99 line testing it as new resistance-turned-support
• RSI(14) plunged into oversold territory (~25) and has since curled back up toward 40, showing early signs of momentum stabilizing after the flush
• MACD histogram remains negative but the red bars have stopped expanding and are flattening bearish momentum fading, a potential early reversal signal
• The last few candles show a basing pattern rather than continued breakdown, with buyers stepping in around the 2,620–2,660 zone
• A push back above the MA99/MA25 cluster (~2,700-2,720) would confirm the bounce has legs toward 2,742–2,781; losing 2,625 support reopens downside risk
$ETH
$ETH USDT
LONG
Leverage: 7x
Entry Zone: 2,670 – 2,680
TP1: 2,716.17 +13%
TP2: 2,742.15 +21%
TP3: 2,781.13 +34%
Stop Loss: 2,625.22
Chart Structure:
• Sharp decline from ~2,800 down through the MA99 (purple) support line, with a hard sell-off candle piercing well below into the 2,620s before bouncing
• Price has since reclaimed ground and is now consolidating right around MA7/MA25, sitting just above the broken MA99 line testing it as new resistance-turned-support
• RSI(14) plunged into oversold territory (~25) and has since curled back up toward 40, showing early signs of momentum stabilizing after the flush
• MACD histogram remains negative but the red bars have stopped expanding and are flattening bearish momentum fading, a potential early reversal signal
• The last few candles show a basing pattern rather than continued breakdown, with buyers stepping in around the 2,620–2,660 zone
• A push back above the MA99/MA25 cluster (~2,700-2,720) would confirm the bounce has legs toward 2,742–2,781; losing 2,625 support reopens downside risk
$ETH