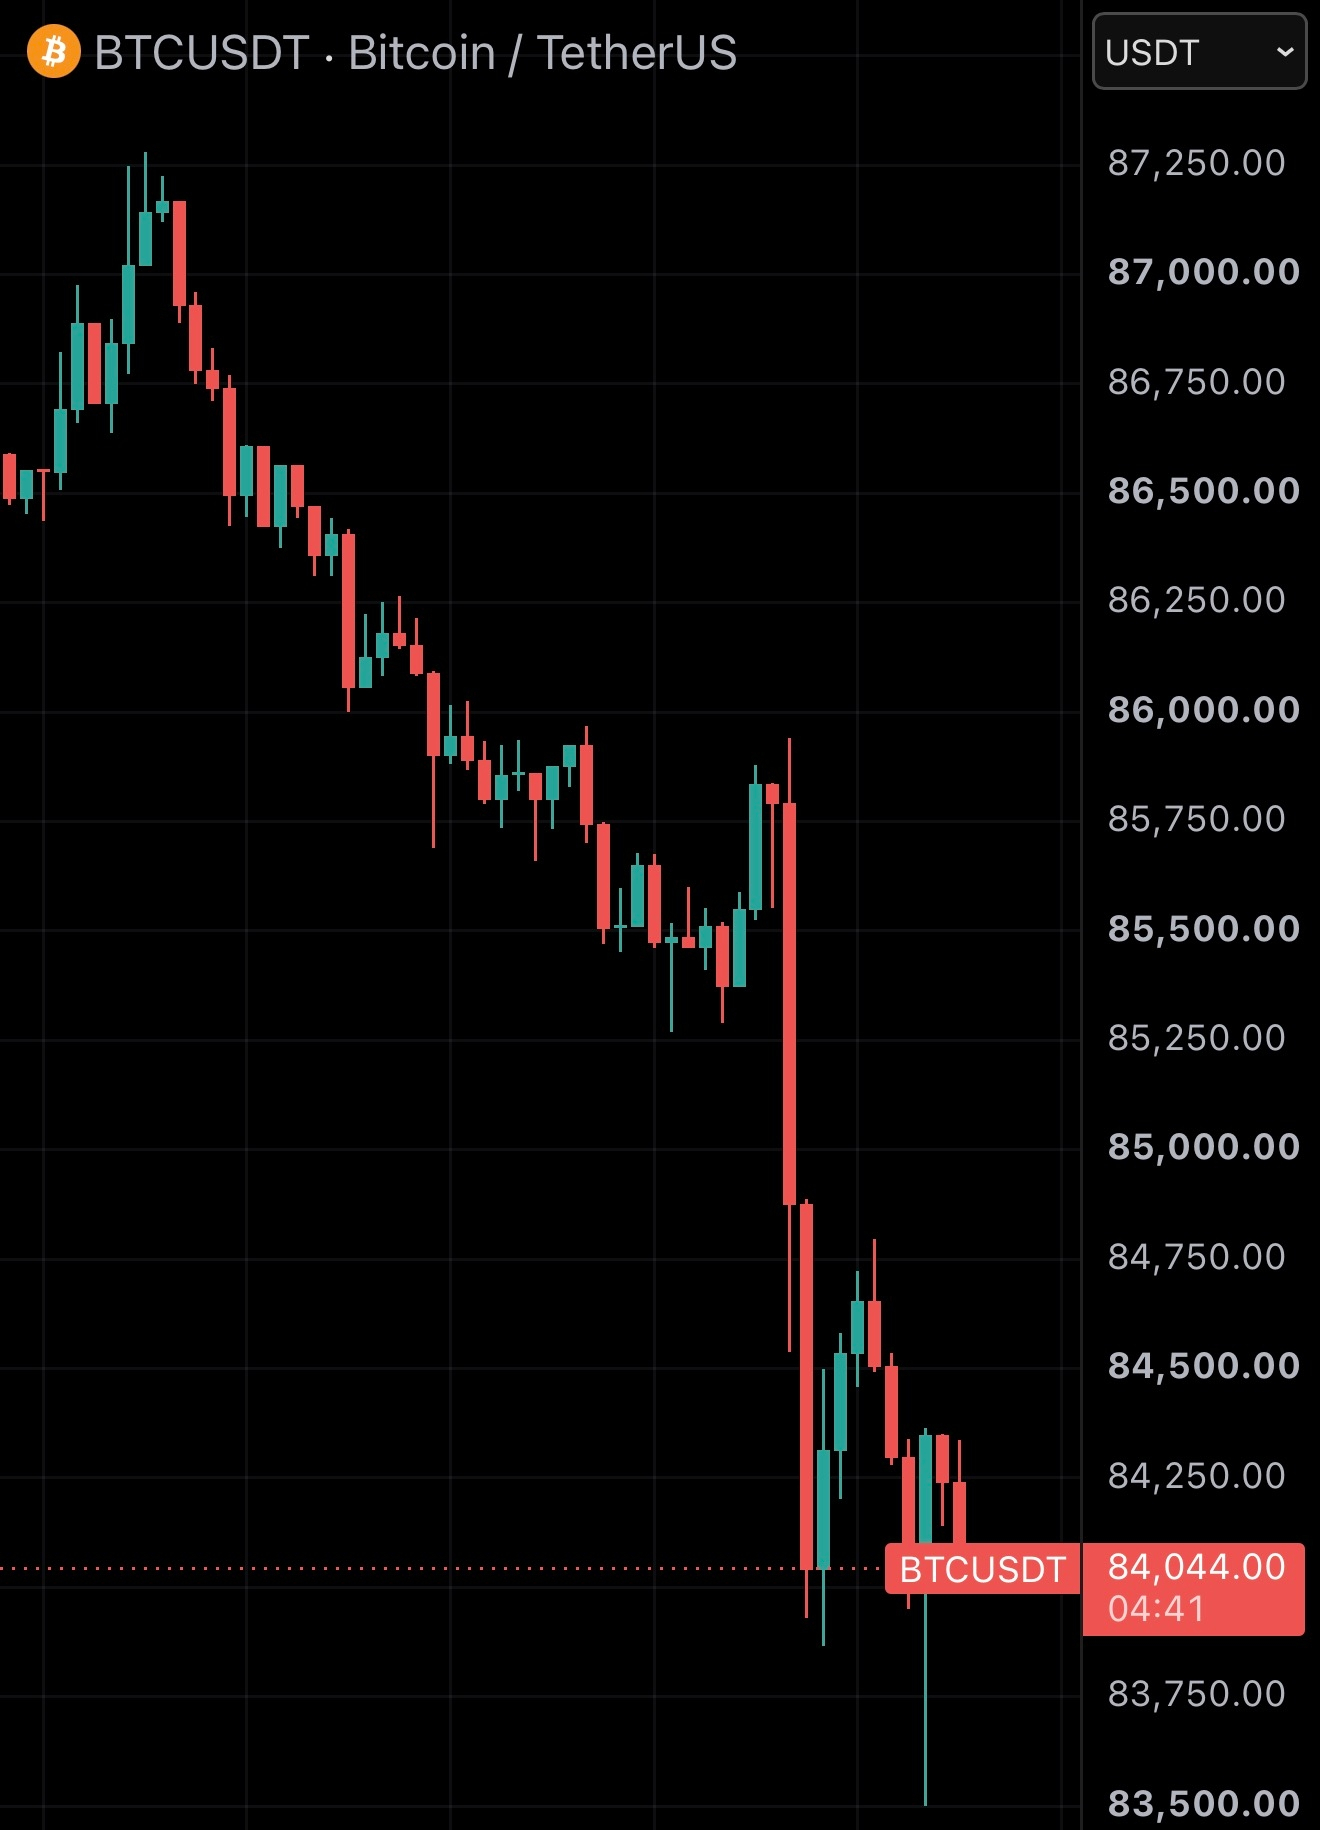
Everyone saw Bitcoin drop nearly $4,000 in just 15 minutes.
Everyone is talking about the crash…
But very few are asking what happened beneath the chart. 👀
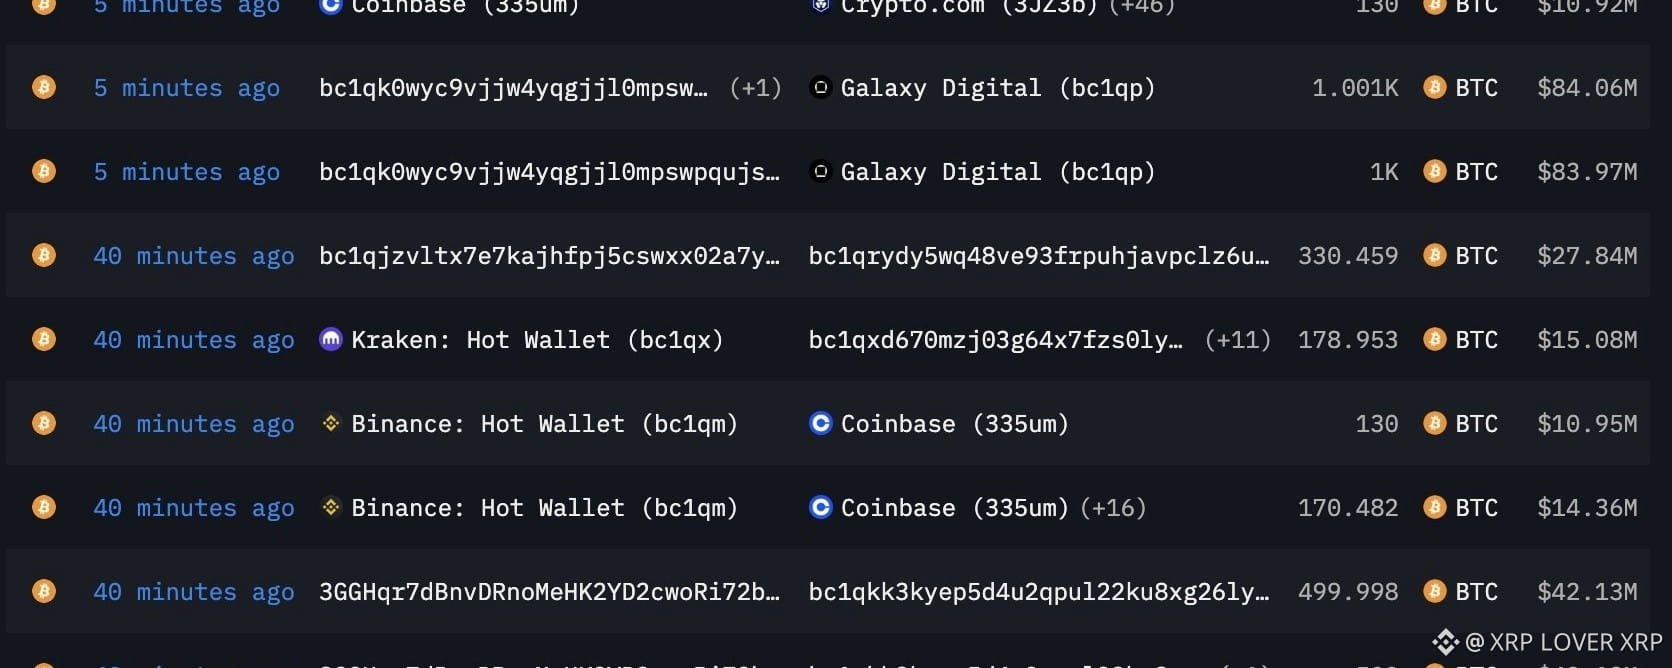
Look at the flows:
🔹 Large BTC movements across major exchanges
🔹 Heavy selling hitting thin order books
🔹 Leverage already stacked in the market
🔹 Funding rates stretched
🔹 Open interest vulnerable to a liquidation cascade
When liquidity is thin and leverage is high, it doesn’t take much to trigger a violent move.
And now comes the interesting part:
🔥 BILLIONS in Bitcoin options are set to expire Friday.
Key levels traders are watching:
$85K → 10,000+ BTC in calls
$90K → 10,000+ BTC in calls
$100K → 7,500 BTC in calls
Meanwhile, billions in leveraged liquidity remain below the market.
That creates a massive battlefield.
Could the move simply be a liquidity sweep?
One possible scenario:
Push price lower → liquidate longs → trigger panic → attract shorts → absorb the selling → reverse higher.
That’s why I’m watching more than just the chart.
👀 Watch: • Funding rates
• Open interest
• Liquidation levels
• Exchange flows
• Options positioning
Bitcoin often moves where the liquidity is.
The next major move could catch the market off guard.
I’ve been trading markets for 15+ years, and I’ll share what I’m watching as it develops.
Turn notifications on. 🔔
Add a stronger opening hook
Tighten the middle for faster reading
Clarify the bullish scenario