TRADING SIGNAL: $XAG /USDT
Pair: $XAG USDT
Direction: LONG 🟢
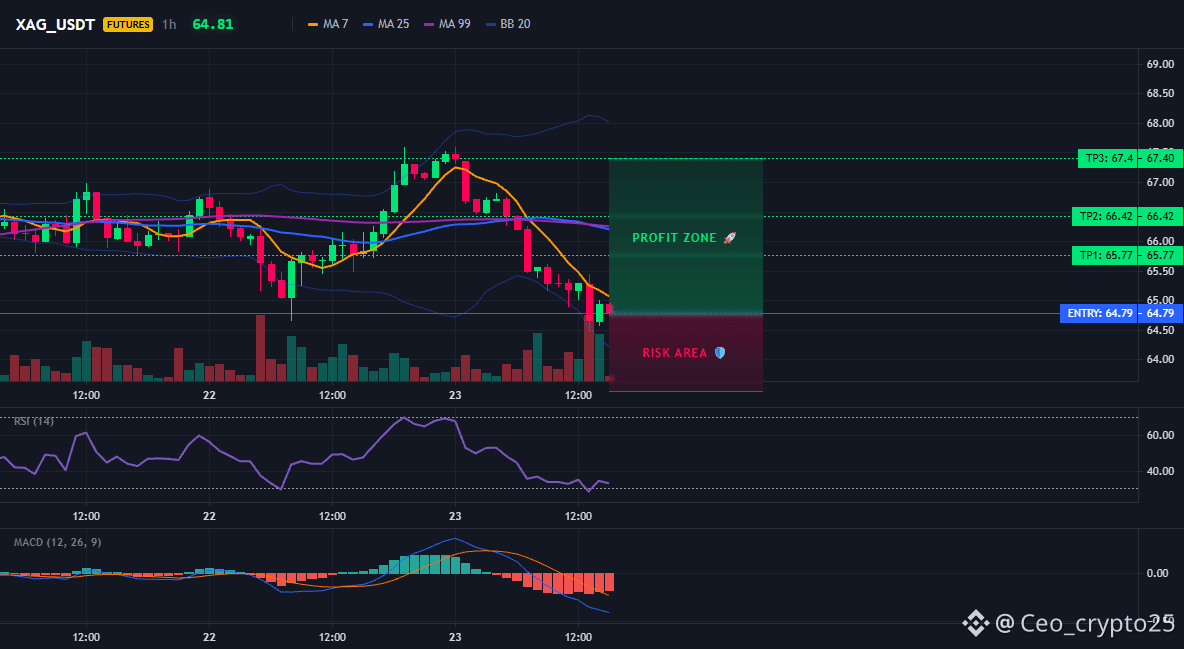
Entry: 64.70 – 64.81
Take-Profit Targets
TP 1: 65.77
TP 2: 66.42
TP 3: 67.40
TP 4: 68.20
Stop-Loss
SL: 63.80
Market Breakdown
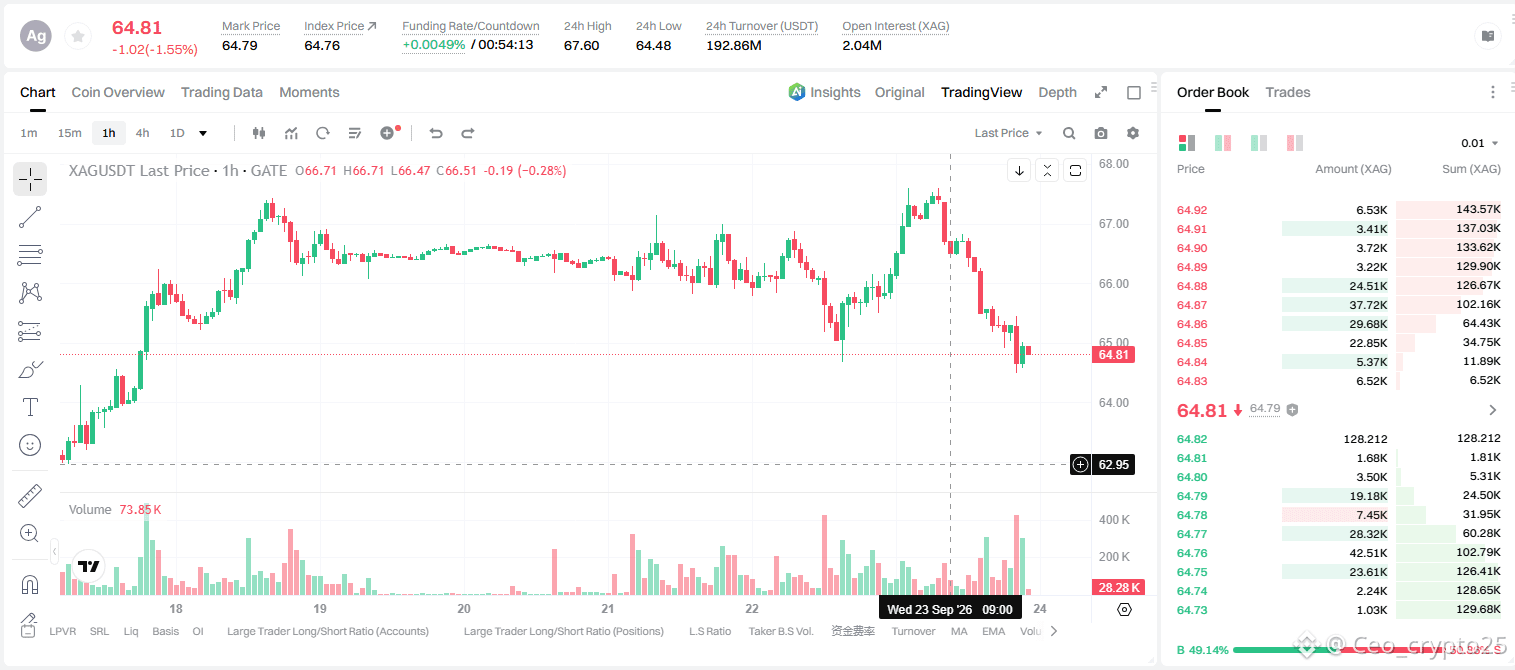
Trend: Mean-reversion long setup on the 1H timeframe following a sharp pull-back from peak levels around 67.50 down to test lower Bollinger Band support near 64.50.
Moving Averages & Indicators: Price is stretched below the \text{MA}(7), \text{MA}(25), and \text{MA}(99) moving averages, setting up a potential snap-back rally. RSI(14) is bottoming out near oversold territory (~30) and MACD histogram bars are beginning to shorten below zero, signaling seller exhaustion.
Volume: Volume spike visible on the recent red candle indicating potential capitulation and buyer absorption near current support.
$XAG
Pair: $XAG USDT
Direction: LONG 🟢
Entry: 64.70 – 64.81
Take-Profit Targets
TP 1: 65.77
TP 2: 66.42
TP 3: 67.40
TP 4: 68.20
Stop-Loss
SL: 63.80
Market Breakdown
Trend: Mean-reversion long setup on the 1H timeframe following a sharp pull-back from peak levels around 67.50 down to test lower Bollinger Band support near 64.50.
Moving Averages & Indicators: Price is stretched below the \text{MA}(7), \text{MA}(25), and \text{MA}(99) moving averages, setting up a potential snap-back rally. RSI(14) is bottoming out near oversold territory (~30) and MACD histogram bars are beginning to shorten below zero, signaling seller exhaustion.
Volume: Volume spike visible on the recent red candle indicating potential capitulation and buyer absorption near current support.
$XAG