

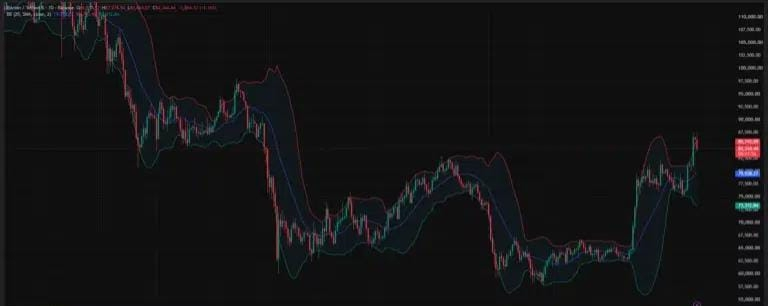

Bitcoin price fell below $85,000 on Sep. 23 after briefly trading above $87,000, as a rally driven partly by short liquidations lost momentum. The daily chart showed BTC near $84,344, down 2.16% for the session.
Bitcoin price pulls back after testing $87K
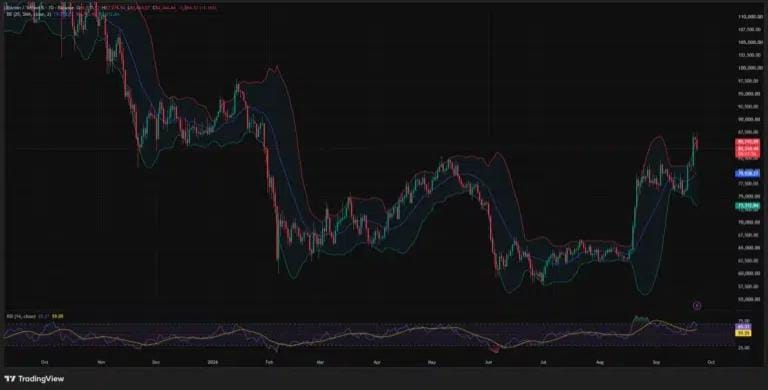
The daily chart shows Bitcoin ( $BTC ) price reaching $87,278.54 before falling to about $84,344. The move took price back below the chart’s $85,743.69 upper Bollinger Band after a sharp climb from mid-September lows near $75,000.
The 4-hour chart captures the latest pullback more clearly. Its current candle fell from an open near $85,650 to roughly $84,329, with a low around $83,864. Price remained above the 4-hour Supertrend line at $83,592.86, though the drop brought that level back into view.
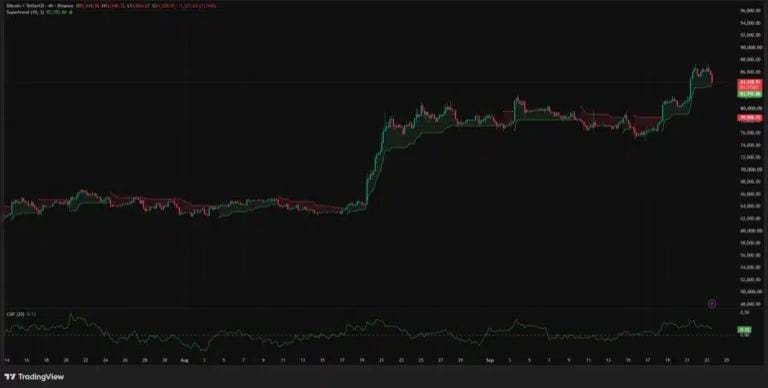
Bitcoin’s daily relative strength index, or RSI, stood at 65.31. A reading above 50 shows that recent gains still outweigh recent losses, but the indicator had eased after approaching the 70 level earlier in the rally. On the 4-hour chart, the Chaikin Money Flow indicator remained positive at 0.12, suggesting buying pressure had not fully disappeared as price pulled back.
The charts therefore show a pause in a strong advance, with the immediate test shifting from whether Bitcoin can extend its breakout to whether buyers defend the levels gained this week.