📊 BTC ANALYSIS
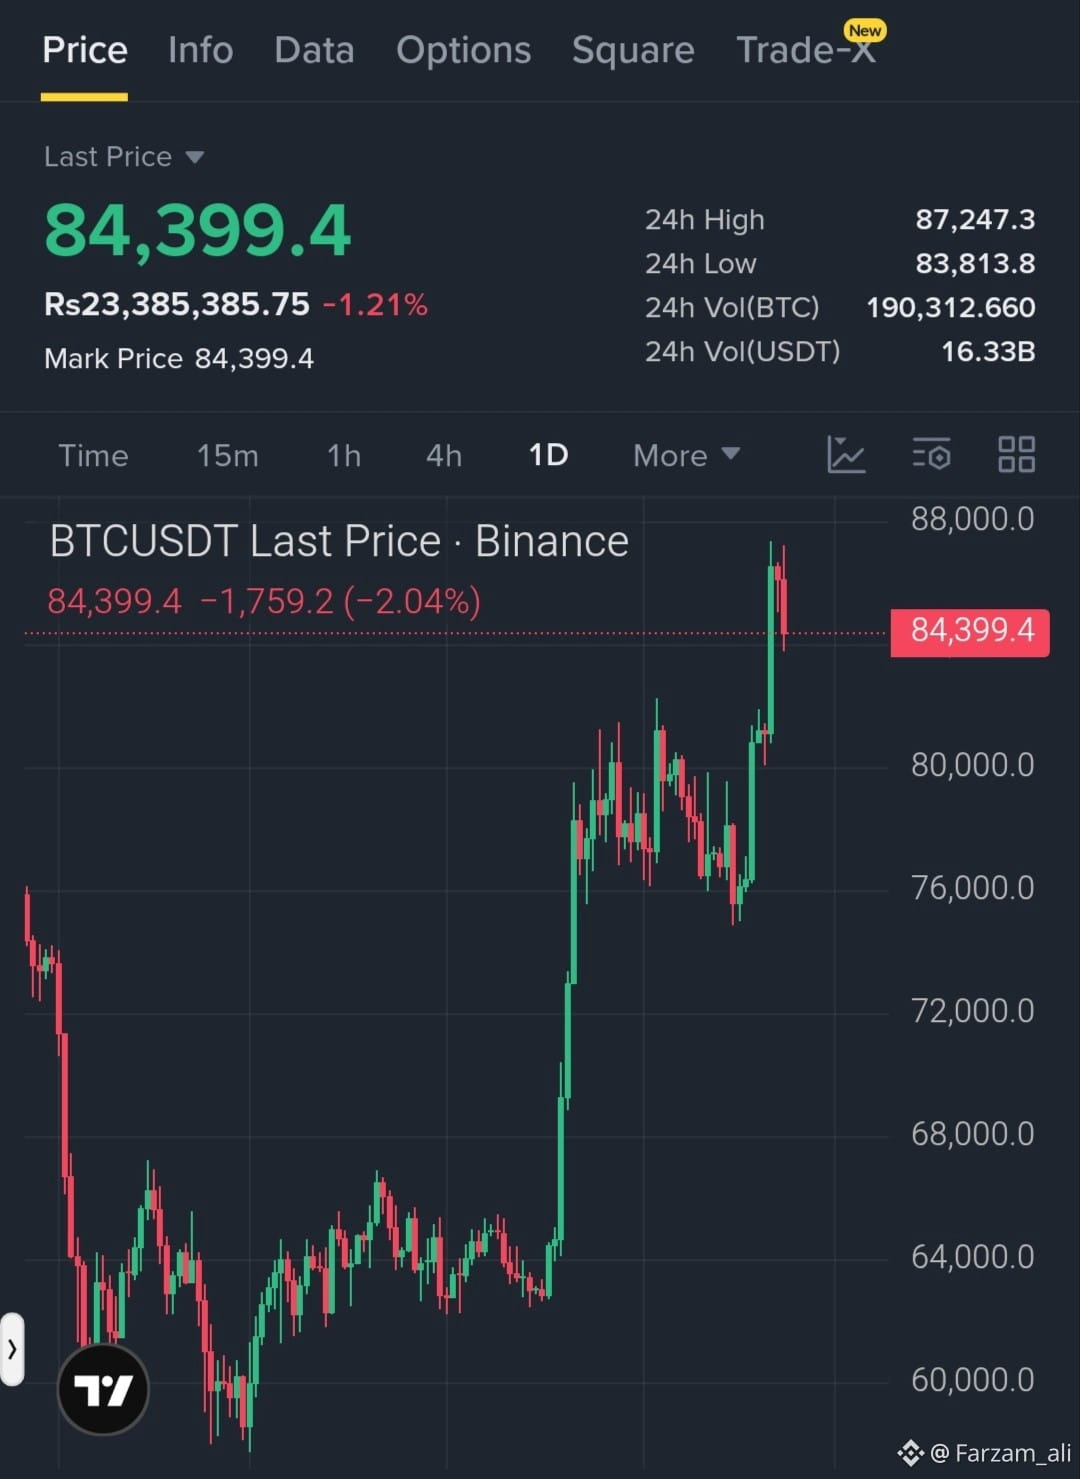
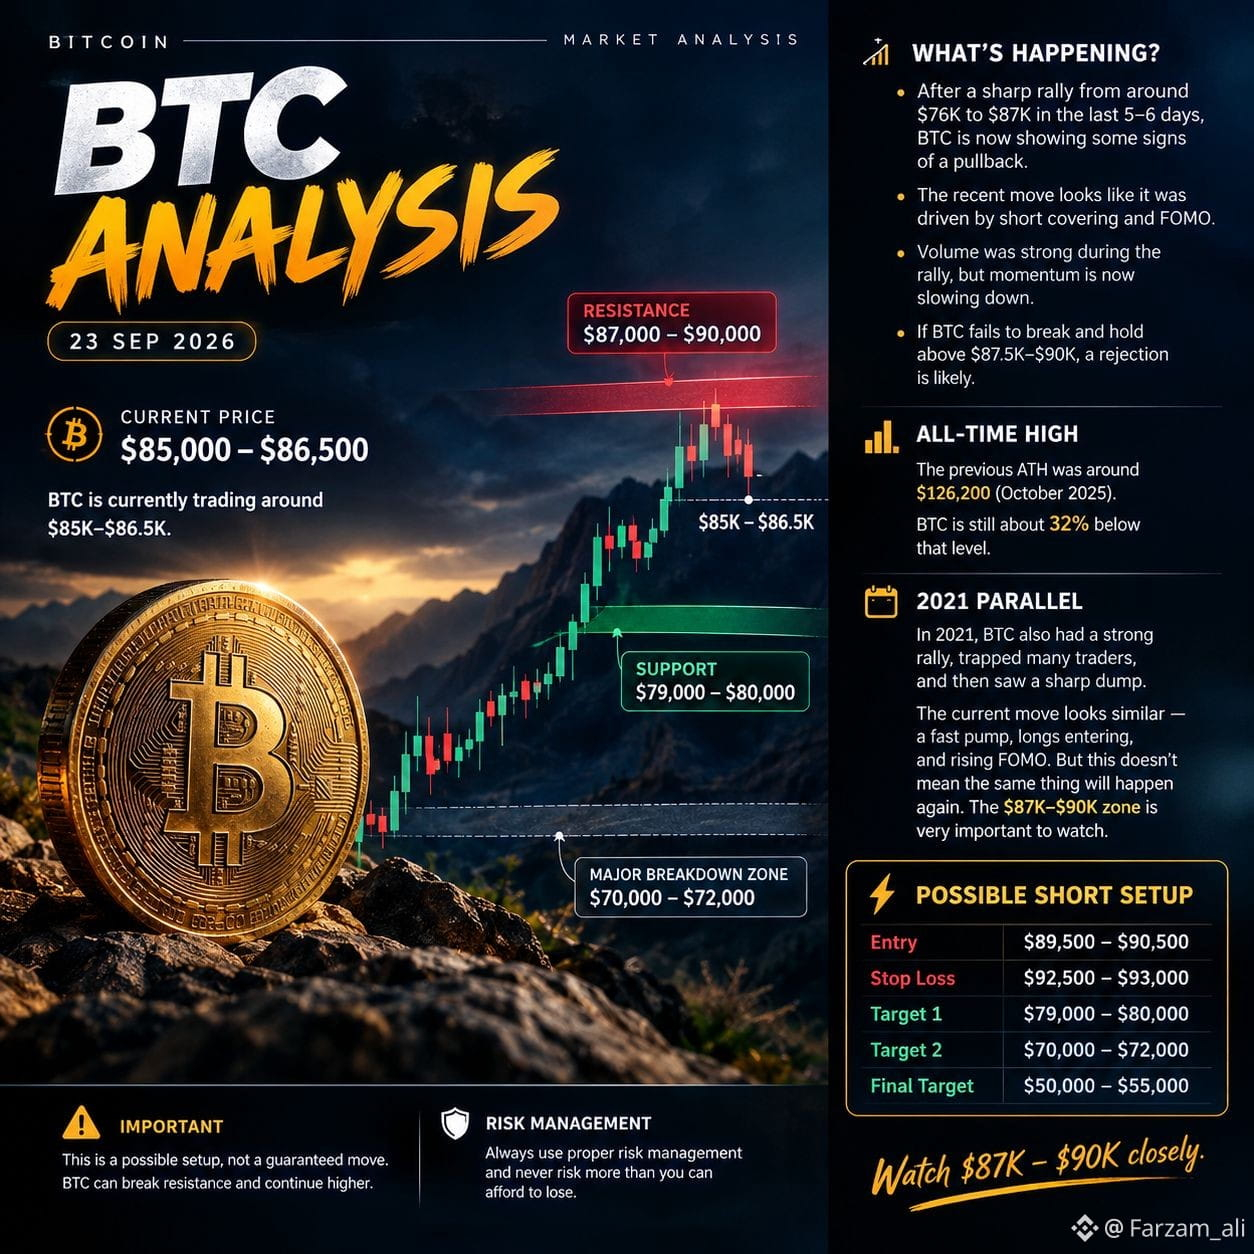
$BTC is currently trading around $85,000–$86,500.
After a sharp rally from around $76K to $87K in the last 5–6 days, BTC is now showing some signs of a pullback.
📌 KEY LEVELS
🔴 Resistance: $87,000–$90,000
🟢 Key Support: $79,000–$80,000
⚠️ Major Breakdown Zone: $70,000–$72,000
$BTC is still around 32% below its previous ATH of ~$126,200 from October 2025.
📈 Technical Picture
• The recent rally was very strong, with good volume.
• Short covering and FOMO may have helped push the price higher.
• Momentum is now starting to slow down.
• If BTC fails to break and hold above $87.5K–$90K, a rejection could happen.
⚠️ 2021 Comparison
The 2021 market also saw strong rallies followed by sharp reversals.
The current move has some similarities: a fast pump, traders entering long positions, and increasing FOMO.
This does not mean the same thing must happen again, but the $87K–$90K zone is very important to watch.
🎯 Possible Short Setup
Entry: $89,500–$90,500
Stop Loss: $92,500–$93,000
Target 1: $79,000–$80,000
Target 2: $70,000–$72,000
Final Target: $50,000–$55,000
⚠️ Important: This is a possible setup, not a guaranteed move. $BTC can break resistance and continue higher.
Watch $87K–$90K closely. 👀
#BTC #Bitcoin #Crypto #BullTrap
$BTC is currently trading around $85,000–$86,500.
After a sharp rally from around $76K to $87K in the last 5–6 days, BTC is now showing some signs of a pullback.
📌 KEY LEVELS
🔴 Resistance: $87,000–$90,000
🟢 Key Support: $79,000–$80,000
⚠️ Major Breakdown Zone: $70,000–$72,000
$BTC is still around 32% below its previous ATH of ~$126,200 from October 2025.
📈 Technical Picture
• The recent rally was very strong, with good volume.
• Short covering and FOMO may have helped push the price higher.
• Momentum is now starting to slow down.
• If BTC fails to break and hold above $87.5K–$90K, a rejection could happen.
⚠️ 2021 Comparison
The 2021 market also saw strong rallies followed by sharp reversals.
The current move has some similarities: a fast pump, traders entering long positions, and increasing FOMO.
This does not mean the same thing must happen again, but the $87K–$90K zone is very important to watch.
🎯 Possible Short Setup
Entry: $89,500–$90,500
Stop Loss: $92,500–$93,000
Target 1: $79,000–$80,000
Target 2: $70,000–$72,000
Final Target: $50,000–$55,000
⚠️ Important: This is a possible setup, not a guaranteed move. $BTC can break resistance and continue higher.
Watch $87K–$90K closely. 👀
#BTC #Bitcoin #Crypto #BullTrap