$BTC IS BACK ABOVE $86K — NOW THE REAL TEST STARTS
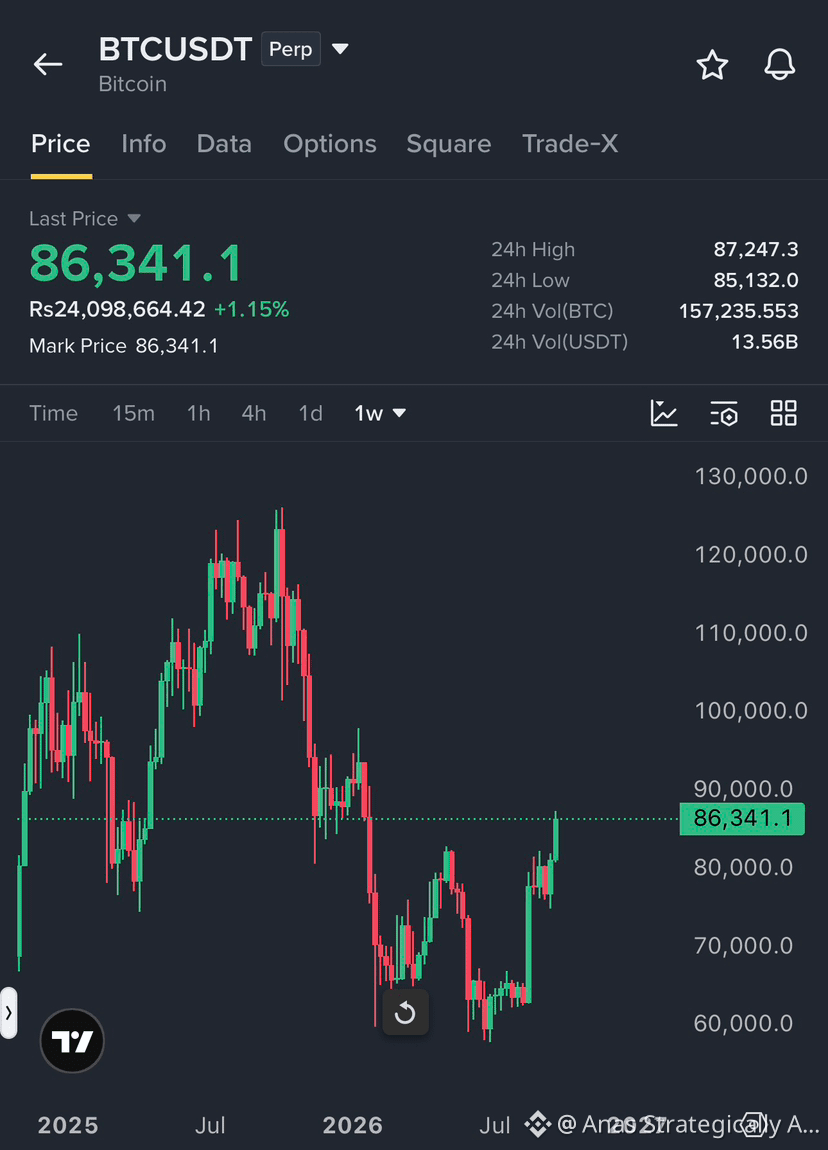
This weekly chart is showing a very different Bitcoin from the one we saw around $60K–$65K.
BTC has climbed back to around $86.3K, after a strong recovery from the September lows. The chart shows a clear shift from the long downtrend into a strong rebound.
But I’m watching one area very closely:
$87K–$90K
BTC already reached around $87.3K, so this zone is now a major test. If buyers can push through and hold above it, the next major psychological level is $100K.
On the other side, if BTC gets rejected here, the important levels on this weekly structure are around:
$82K → $78K → $70K
One more thing is interesting: U.S. spot Bitcoin ETFs recorded about $999M of net inflows on September 21, adding fuel to the recent move.
But after a move this fast, I wouldn’t chase blindly.
BTC has recovered.
Now it needs to prove it can hold.
The next few weekly candles could be very important.
This weekly chart is showing a very different Bitcoin from the one we saw around $60K–$65K.
BTC has climbed back to around $86.3K, after a strong recovery from the September lows. The chart shows a clear shift from the long downtrend into a strong rebound.
But I’m watching one area very closely:
$87K–$90K
BTC already reached around $87.3K, so this zone is now a major test. If buyers can push through and hold above it, the next major psychological level is $100K.
On the other side, if BTC gets rejected here, the important levels on this weekly structure are around:
$82K → $78K → $70K
One more thing is interesting: U.S. spot Bitcoin ETFs recorded about $999M of net inflows on September 21, adding fuel to the recent move.
But after a move this fast, I wouldn’t chase blindly.
BTC has recovered.
Now it needs to prove it can hold.
The next few weekly candles could be very important.