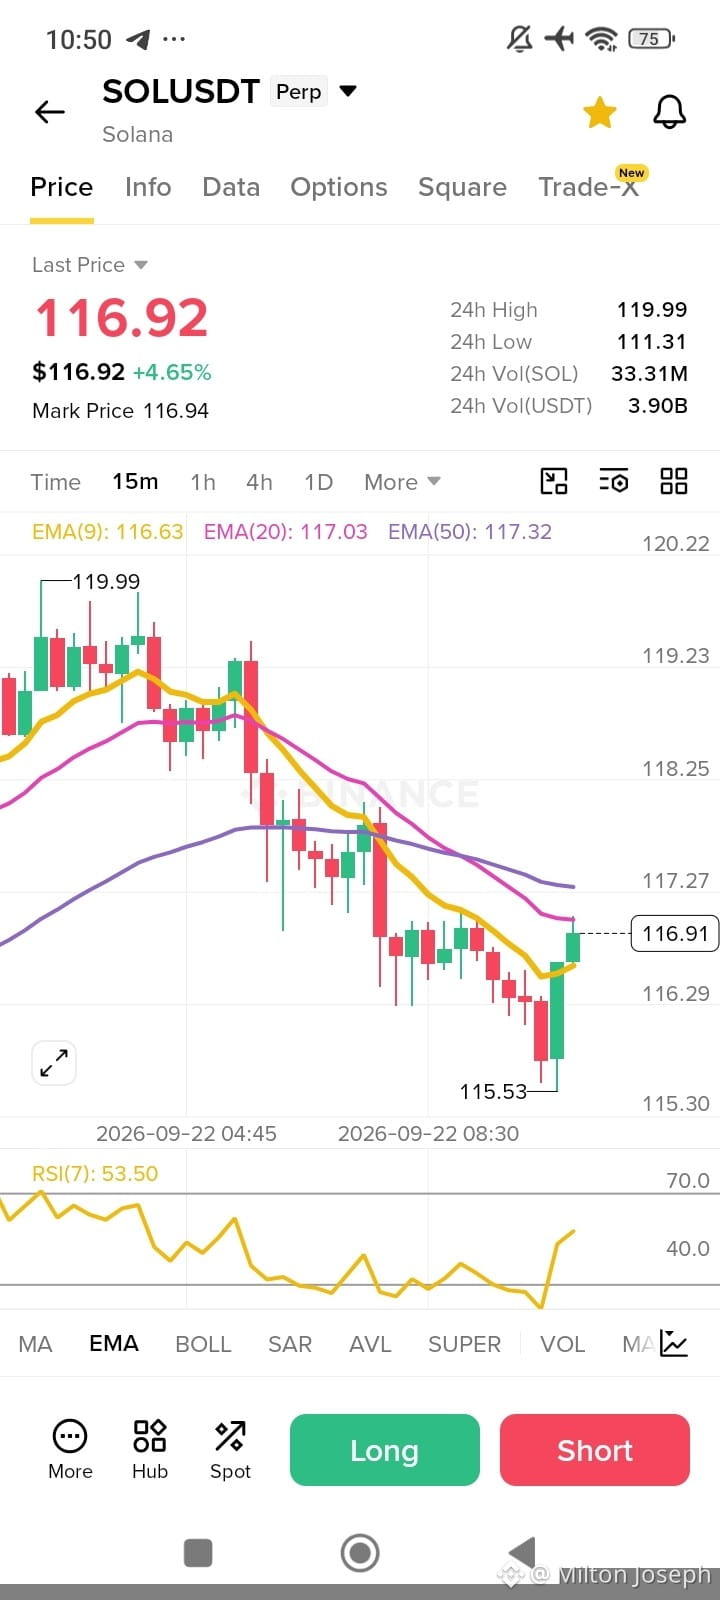
$SOL The 15-minute SOLUSDT chart shows a short-term bullish bounce within an overall short-term downtrend.
Key technical observations from the chart:
Price Action & Trend: SOL peaked near $119.99 before making lower highs and lower lows, bottoming out at $115.53. A recent strong green reversal candle has pushed the price back up to around $116.92.
Exponential Moving Averages (EMA):
EMA(9): $116.63
EMA(20): $117.03
EMA(50): $117.32
The price is currently crossing above the fast EMA(9), but remains below both the EMA(20) and EMA(50), indicating that the broader 15m trend is still bearish.
Relative Strength Index (RSI 7): Sitting at 53.50, recovery from oversold levels below 30, showing neutral-to-bullish momentum in the immediate term.
Key Levels to Watch:
Immediate Resistance: $117.00 - $117.30 (confluence of EMA 20 and EMA 50). A break above this region is needed to signal a trend reversal.
Immediate Support: $116.29, followed by the recent low at $115.53.
Key technical observations from the chart:
Price Action & Trend: SOL peaked near $119.99 before making lower highs and lower lows, bottoming out at $115.53. A recent strong green reversal candle has pushed the price back up to around $116.92.
Exponential Moving Averages (EMA):
EMA(9): $116.63
EMA(20): $117.03
EMA(50): $117.32
The price is currently crossing above the fast EMA(9), but remains below both the EMA(20) and EMA(50), indicating that the broader 15m trend is still bearish.
Relative Strength Index (RSI 7): Sitting at 53.50, recovery from oversold levels below 30, showing neutral-to-bullish momentum in the immediate term.
Key Levels to Watch:
Immediate Resistance: $117.00 - $117.30 (confluence of EMA 20 and EMA 50). A break above this region is needed to signal a trend reversal.
Immediate Support: $116.29, followed by the recent low at $115.53.