

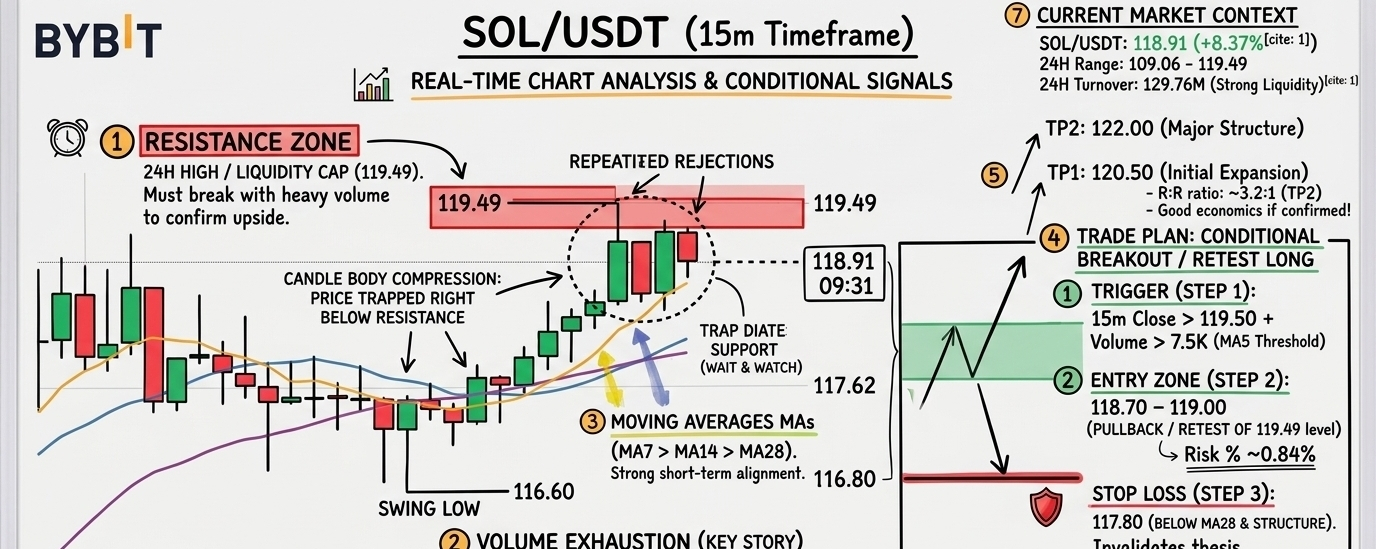

I was skimming through the SOL chart expecting a standard consolidation, but the sharp contraction in volume right under the local high caught my attention.
SOL/USDT is currently trading at 118.91, up +8.37% over the last 24 hours. The pair has traded between a 24H low of 109.06 and a high of 119.49, pulling 129.76M USDT in turnover.
Looking at the 15-minute timeframe, price pushed up aggressively from the 116.60 swing low to hit 119.49. Since hitting that peak, candle bodies are compressing tightly right above the moving averages rather than pulling back sharply.
Moving average alignment shows a short-term bullish stack:
MA7: 118.68
MA14: 118.10
MA28: 117.96
Price is holding cleanly above the MA7 (118.68), with MA14 and MA28 fanning out underneath to act as dynamic trailing support.
However, the volume profile demands caution. Current volume sits at 4.23K, which is noticeably below the MA5 volume of 7.48K and MA10 volume of 6.58K. Volume has dropped roughly 43% below its 5-period average during this consolidation. While price compression near highs can precede an expansion, breaking 119.49 without volume participation risks a swift fakeout rejection.
What I Like:
Clean bullish alignment with price staying well above MA7, MA14, and MA28.
Higher low established at 116.60 with rapid recovery.
Deep liquidity and strong 24H turnover (129.76M USDT) ensuring smooth execution.
What I Don't Like:
Volume is actively fading as price sits right under resistance.
Immediate upside is capped by the 119.49 high, offering a tight local range.
Risk of a leverage flush down to test MA28 if buyers get impatient.
Key Levels:
Resistance: 119.49 (24H High / Local Liquidity Cap)
Support: 118.10 – 118.68 (MA7 / MA14 Cluster)
Invalidation: 116.60 (Recent Swing Low)
Trade Plan: CONDITIONAL BREAKOUT / RETEST LONG
Chasing market buys inside this low-volume consolidation offers poor risk/reward. I prefer waiting for explicit confirmation.
Trigger: 15m candle close above 119.50 accompanied by volume crossing above 7.5K (MA5 threshold).
Entry Zone: 118.70 – 119.00 (on pullback/retest of broken resistance)
Target 1 (TP1): 120.50 (Initial expansion zone)
Target 2 (TP2): 122.00 (Major overhead structural level)
Stop Loss (SL): 117.80 (Just below MA28 and local structure)
Risk & Calculations:
Risk: ~0.84% (from ~118.80 entry down to 117.80 SL)
Reward (TP1): ~1.43% | Reward (TP2): ~2.69%
R:R Ratio: ~1.7:1 (TP1) / ~3.2:1 (TP2)
Final View:
Structure remains constructive, but buying straight into resistance on declining volume is a quick way to get chopped up. If volume returns and pushes price past 119.49, the move towards 122.00 opens up quickly. Until then, keeping orders on hold is the disciplined call.
Will buyers step in with real volume to push past 119.49, or are we due for a sweep down to test the MA28 dynamic support?
#Bybit #CryptoTrading #SOL