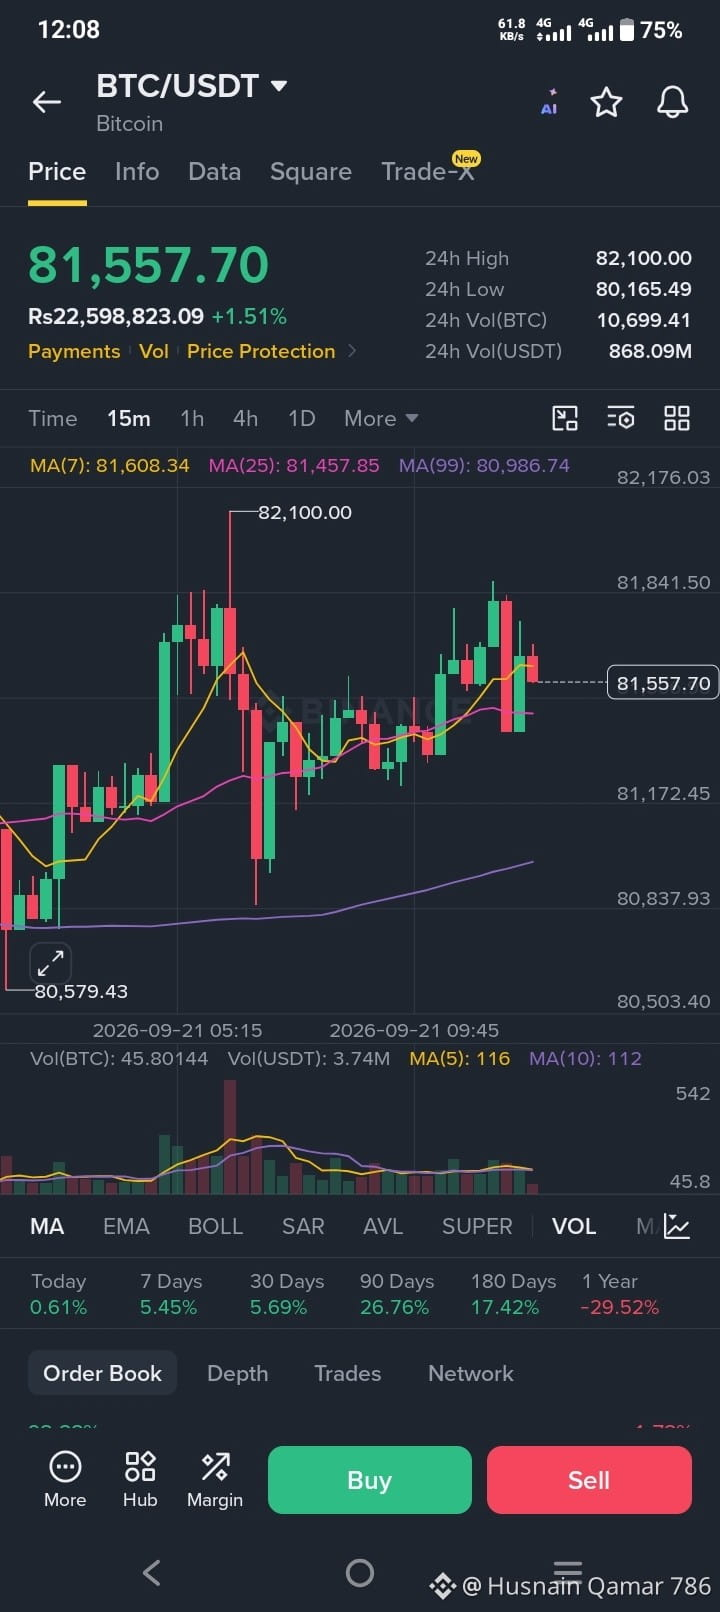
📊 BTC/USDT 15-Minute Technical Analysis
Current price: $81,557.70
24H High: $82,100
24H Low: $80,165.49
Market structure:
BTC is holding above MA(25) at $81,457, which is a positive short-term sign.
MA(7) = $81,608 → price is slightly below the short-term MA, showing some hesitation.
MA(99) = $80,987 → price remains comfortably above the longer MA.
Recent candles show rejection around $81,840–$82,100.
🔑 Key Levels
Resistance:
➡️ $81,840
➡️ $82,100
➡️ $82,175
Support:
➡️ $81,450
➡️ $81,170
➡️ $80,990
➡️ $80,580
📈 Bullish Scenario
If BTC breaks and holds above $82,100, especially with increasing volume, the next move could target the $82,500–$83,000 area.
📉 Bearish Scenario
If BTC loses $81,450, momentum could weaken toward $81,170. A stronger breakdown below $80,990 would put the $80,580 area back into focus.
My read from this chart: BTC is currently in a short-term consolidation just below resistance. The $82,100 breakout or $81,450 breakdown should provide a clearer direction.$BTC $ETH
Current price: $81,557.70
24H High: $82,100
24H Low: $80,165.49
Market structure:
BTC is holding above MA(25) at $81,457, which is a positive short-term sign.
MA(7) = $81,608 → price is slightly below the short-term MA, showing some hesitation.
MA(99) = $80,987 → price remains comfortably above the longer MA.
Recent candles show rejection around $81,840–$82,100.
🔑 Key Levels
Resistance:
➡️ $81,840
➡️ $82,100
➡️ $82,175
Support:
➡️ $81,450
➡️ $81,170
➡️ $80,990
➡️ $80,580
📈 Bullish Scenario
If BTC breaks and holds above $82,100, especially with increasing volume, the next move could target the $82,500–$83,000 area.
📉 Bearish Scenario
If BTC loses $81,450, momentum could weaken toward $81,170. A stronger breakdown below $80,990 would put the $80,580 area back into focus.
My read from this chart: BTC is currently in a short-term consolidation just below resistance. The $82,100 breakout or $81,450 breakdown should provide a clearer direction.$BTC $ETH