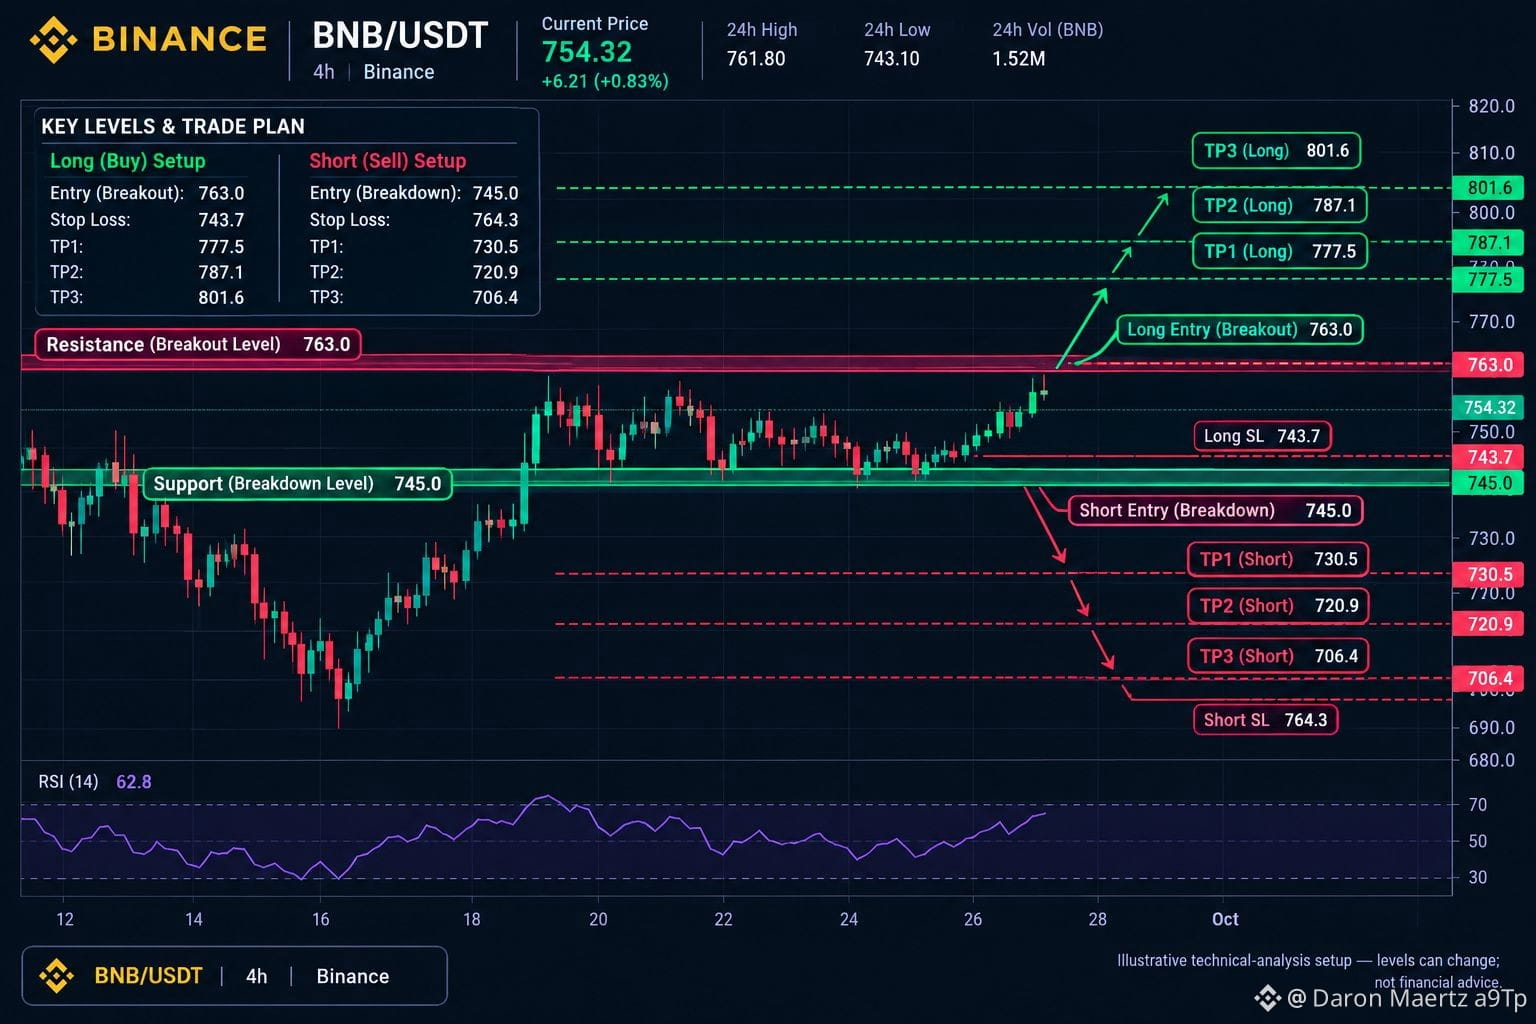
BNB/USDT Technical Analysis: Key Levels to Watch! 🚀
Current Price Action:
BNB is currently trading around the $750 - $770 range. After testing the psychological support near $700-$715 recently, buyers have successfully stepped back in, showing strong resilience. The broader structure remains constructive as BNB sustains its position above key moving averages
📈 Bullish Scenario (Upside Targets):
Immediate Resistance: $780
Major Breakout Trigger: $800 - $823
Analysis: If $BNB forces a daily close above the $780 resistance with solid trading volume, momentum will quickly shift toward the $823 psychological barrier. Breaking this zone clears the path for an extended rally toward its long-term targets
📉 Bearish Scenario (Downside Risks):
Immediate Support: $730 - $745
Major Demand Zone: $690 - $700
Analysis: In case of a short-term market-wide pullback, the $732 area will act as the first line of defense. However, a major breakdown below $680 would invalidate the current bullish structure and might trigger a deeper correction
🛠 Technical Indicators Snapshot:
RSI (14): Sitting comfortably around 51.6 (Neutral Zone), leaving plenty of room for an upside movement without being overbought.
Moving Averages: The 4-Hour chart displays perfectly stacked short-term MAs, indicating steady buying pressure.
Fundamental Boost: BNB Chain continues to dominate Real-World Asset (RWA) expansion, adding solid fundamental value to the token utility
🎯 Trade Setup Idea:
Safe Entry: On a confirmed breakout above $780 OR on a successful retest of the $735 support area.
Stop Loss: Below $685
What are your thoughts? Will BNB break above $800 this week or retest lower support levels first? Let's discuss in the comments! 👇
#BİNANCESQUARE #TechnicalAnalysis
Current Price Action:
BNB is currently trading around the $750 - $770 range. After testing the psychological support near $700-$715 recently, buyers have successfully stepped back in, showing strong resilience. The broader structure remains constructive as BNB sustains its position above key moving averages
📈 Bullish Scenario (Upside Targets):
Immediate Resistance: $780
Major Breakout Trigger: $800 - $823
Analysis: If $BNB forces a daily close above the $780 resistance with solid trading volume, momentum will quickly shift toward the $823 psychological barrier. Breaking this zone clears the path for an extended rally toward its long-term targets
📉 Bearish Scenario (Downside Risks):
Immediate Support: $730 - $745
Major Demand Zone: $690 - $700
Analysis: In case of a short-term market-wide pullback, the $732 area will act as the first line of defense. However, a major breakdown below $680 would invalidate the current bullish structure and might trigger a deeper correction
🛠 Technical Indicators Snapshot:
RSI (14): Sitting comfortably around 51.6 (Neutral Zone), leaving plenty of room for an upside movement without being overbought.
Moving Averages: The 4-Hour chart displays perfectly stacked short-term MAs, indicating steady buying pressure.
Fundamental Boost: BNB Chain continues to dominate Real-World Asset (RWA) expansion, adding solid fundamental value to the token utility
🎯 Trade Setup Idea:
Safe Entry: On a confirmed breakout above $780 OR on a successful retest of the $735 support area.
Stop Loss: Below $685
What are your thoughts? Will BNB break above $800 this week or retest lower support levels first? Let's discuss in the comments! 👇
#BİNANCESQUARE #TechnicalAnalysis