
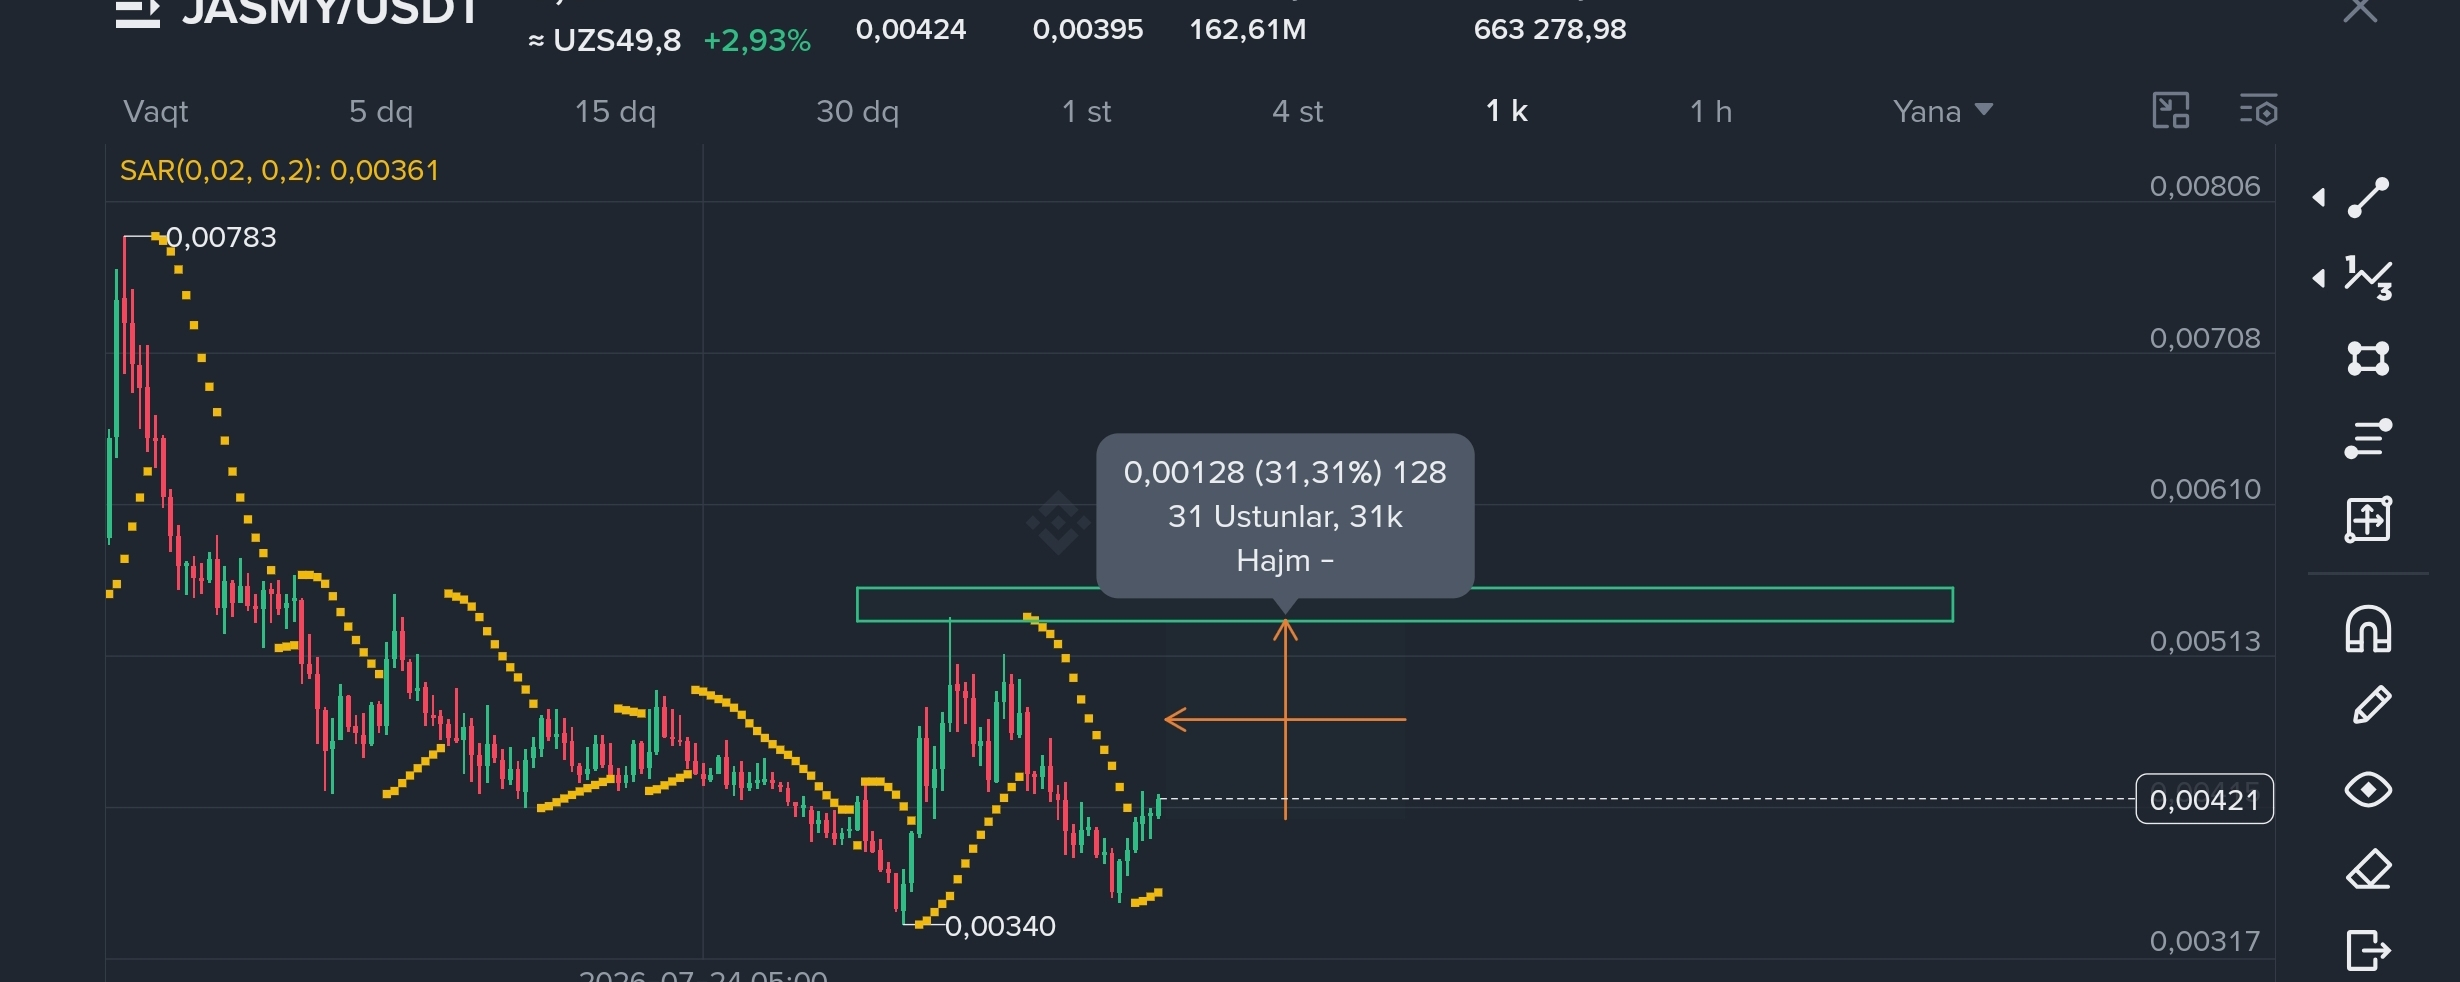

JASMY/USDT is showing signs of a potential recovery on the daily chart. After a prolonged downtrend and a bounce from the 0.00340 USDT area, price action is now approaching an important technical zone.
Could buyers push JASMY toward the next resistance area? Let's take a look. 👇
📊 Current Price: 0.00421 USDT
🔹 Previous Low: 0.00340 USDT
🔹 Intermediate Resistance: Around 0.00460–0.00490 USDT
🔹 Major Resistance Zone: Approximately 0.00513–0.00555 USDT
🔹 Measured Upside: 31.31%
📈 MY TECHNICAL ANALYSIS
On the 1D chart, JASMY has experienced a significant decline from its previous high near 0.00783 USDT.
After reaching a low around 0.00340 USDT, the price started to recover. Recent candles show a short-term upward movement, while the Parabolic SAR dots have shifted below the price in the latest section of the chart.
This could indicate improving buying momentum, but a confirmed trend reversal would require additional evidence.
🎯 MY MAIN TARGET ZONE
The resistance area around 0.00513–0.00555 USDT is the key zone I am monitoring.
Based on my chart measurement, the projected move represents approximately 31.31% upside from the reference point.
However, this is a technical projection, not a guaranteed target. Price may face resistance before reaching this zone.
🔍 KEY LEVELS TO WATCH
🟢 Bullish Scenario
If JASMY breaks above the intermediate resistance levels with strong buying volume and a confirmed daily candle close, the higher resistance zone could become the next area of interest.
Confirmation matters more than simply seeing a temporary price spike.
🔴 Rejection Scenario
If sellers regain control near resistance, JASMY could experience a pullback and retest lower support areas.
The 0.00340 USDT region remains an important historical reference on this chart.
📊 INDICATORS & PRICE ACTION
The Parabolic SAR currently appears below the latest price candles, which may support a short-term bullish interpretation.
Nevertheless, SAR can produce false signals, especially during sideways market conditions. Combining it with volume, support and resistance, and candle closes can provide a more complete analysis.
💡 FINAL THOUGHTS
JASMY/USDT is a pair I am watching closely as it attempts to recover from its recent lows.
The main question is:
Can JASMY break through the intermediate resistance and move toward the 0.00513–0.00555 USDT zone? 🚀
📈 Bullish breakout or another rejection?
What is your analysis of JASMY?
Share your thoughts in the comments! 👇
⚠️ This article is for educational purposes only and does not constitute financial advice. Always conduct your own research and manage your risk.
#JASMY #CryptoAnalysis #Binance #TechnicalAnalysis #CryptoTrading #SpotTrading