📊 $BTC/USDT — 1D Chart Analysis
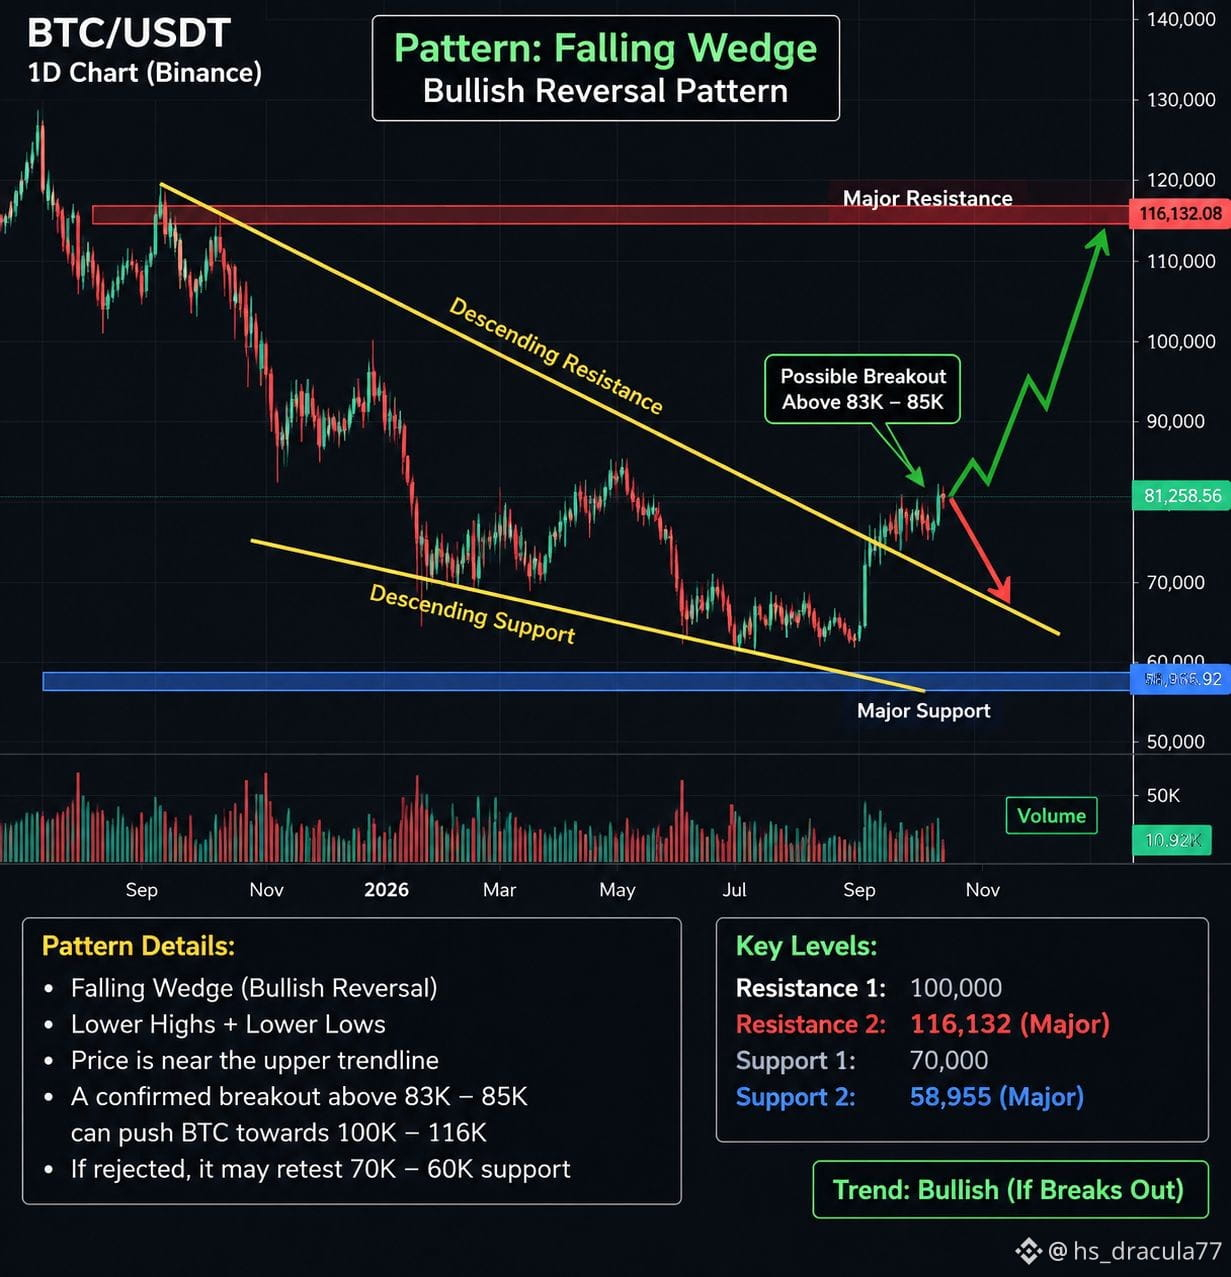
$BTC is currently trading around $81,258 and the 1D chart is showing a falling-wedge type structure after the larger decline.
The key area to watch is $83K–$85K. A daily close and confirmation above this zone would indicate a breakout from the upper trendline and could open the way toward $90K → $100K.
$BTC On the downside, rejection around $83K–$85K could bring a retest of $70K, while the major long-term support shown on the chart is around $58,955.
Key levels:
🟢 Current: $81,258
🔥 Breakout zone: $83K–$85K
🎯 Resistance: $90K → $100K
🔴 Major resistance: $116,132
🟡 Support: $70K
🔵 Major support: $58,955
Important: The falling-wedge interpretation is only confirmed if $BTC breaks and holds above the upper trendline; otherwise, the structure can still produce another rejection.
#BTCUSDT #Binance #TechnicalAnalysis #cryptotrading #BitcoinAnalysis
$BTC is currently trading around $81,258 and the 1D chart is showing a falling-wedge type structure after the larger decline.
The key area to watch is $83K–$85K. A daily close and confirmation above this zone would indicate a breakout from the upper trendline and could open the way toward $90K → $100K.
$BTC On the downside, rejection around $83K–$85K could bring a retest of $70K, while the major long-term support shown on the chart is around $58,955.
Key levels:
🟢 Current: $81,258
🔥 Breakout zone: $83K–$85K
🎯 Resistance: $90K → $100K
🔴 Major resistance: $116,132
🟡 Support: $70K
🔵 Major support: $58,955
Important: The falling-wedge interpretation is only confirmed if $BTC breaks and holds above the upper trendline; otherwise, the structure can still produce another rejection.
#BTCUSDT #Binance #TechnicalAnalysis #cryptotrading #BitcoinAnalysis