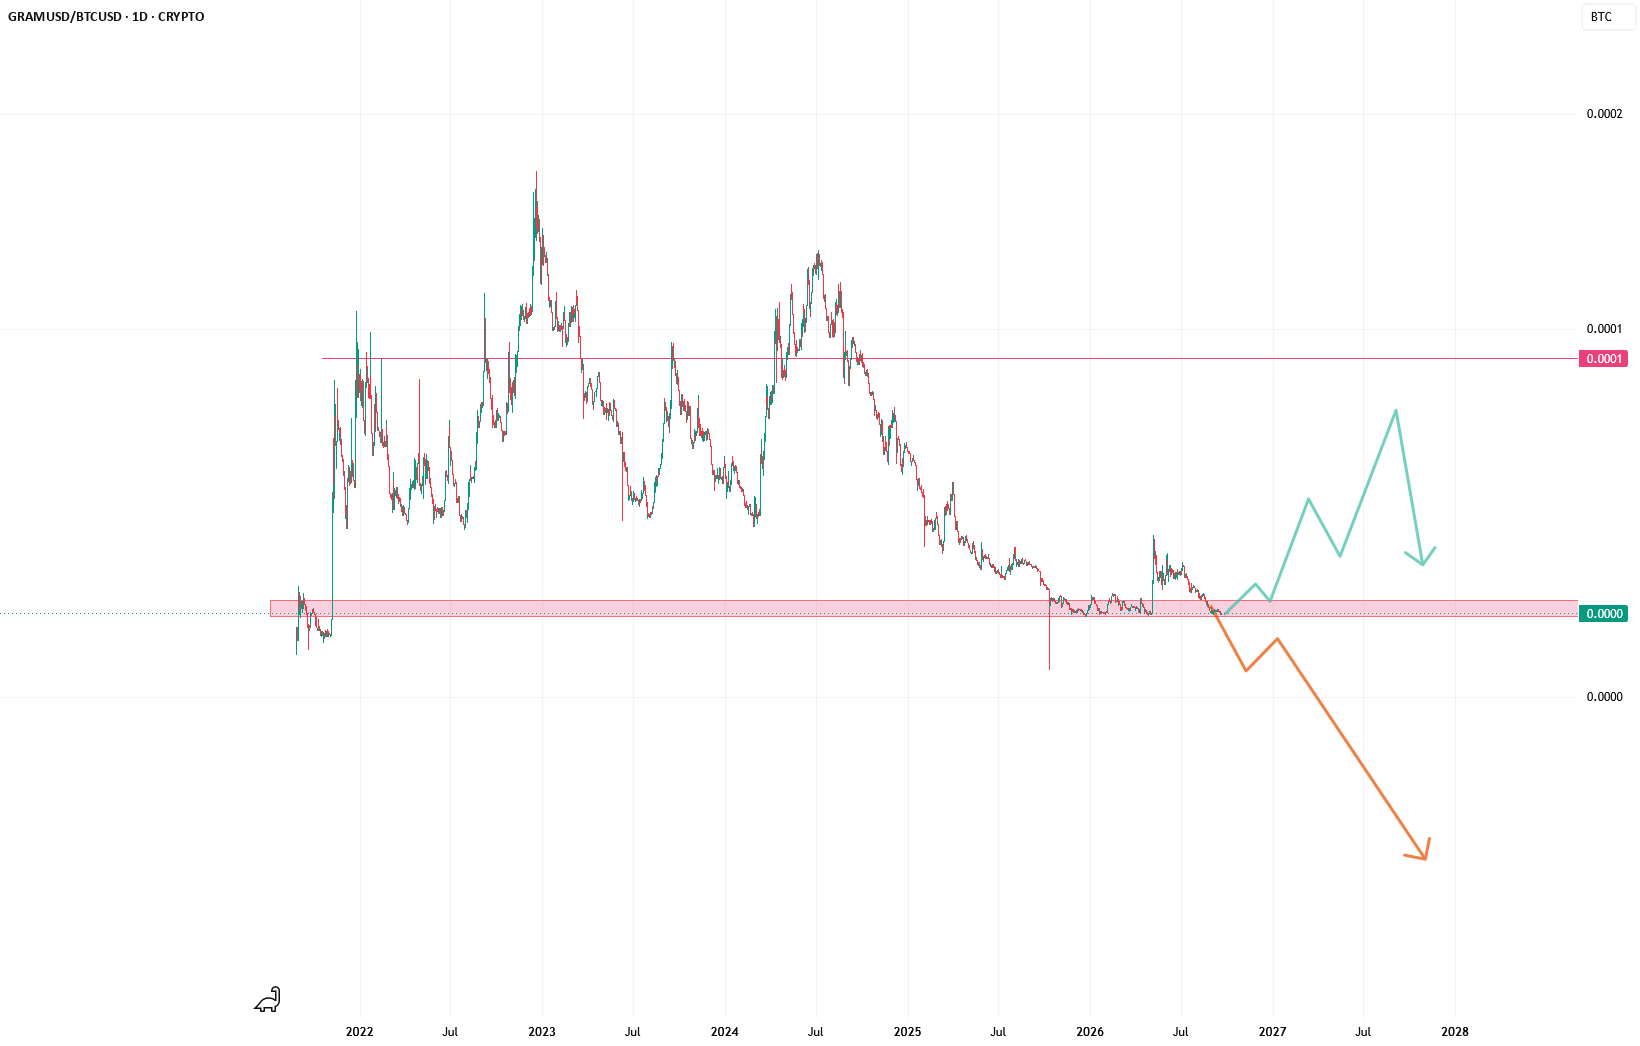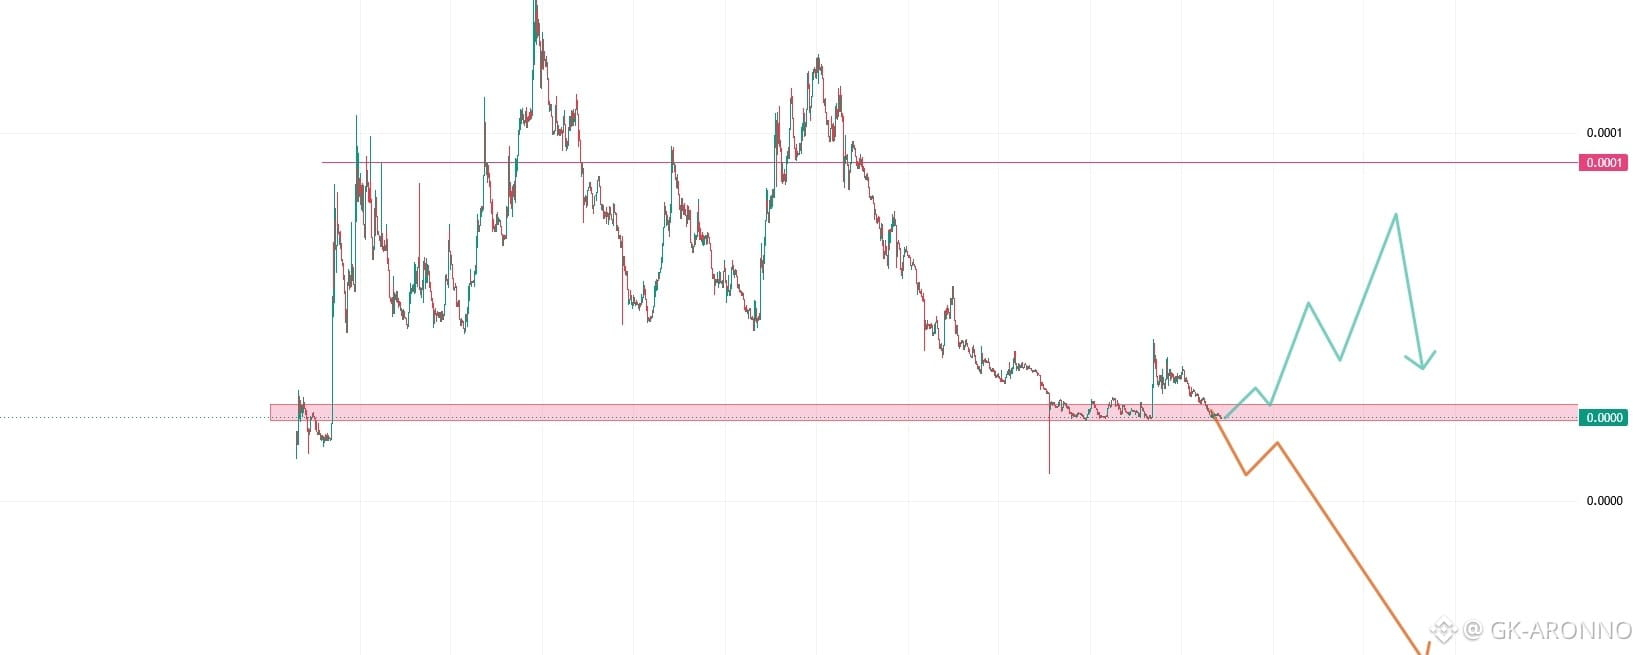

:The daily chart of GRAM/BTC is hovering around a major historical demand zone after an extended downtrend. Key Observations:Price is retesting the major support level (red horizontal band) which previously initiated strong upward reactions.
High compression at support signals an impending volatility expansion.
Two Scenarios:Bullish (Green path): Sustained demand and a confirmed reversal structure above this support could trigger a substantial relief rally toward overhead resistance targets. Bearish (Orange path): A decisive daily close below this floor followed by a rejected retest would validate further downside continuation.
Always manage your risk and wait for confirmation before executing trades

GRAMUSDT
無期限
1.426
+3.93%