Is $TUT taking a breather or setting up the next move? 🤔
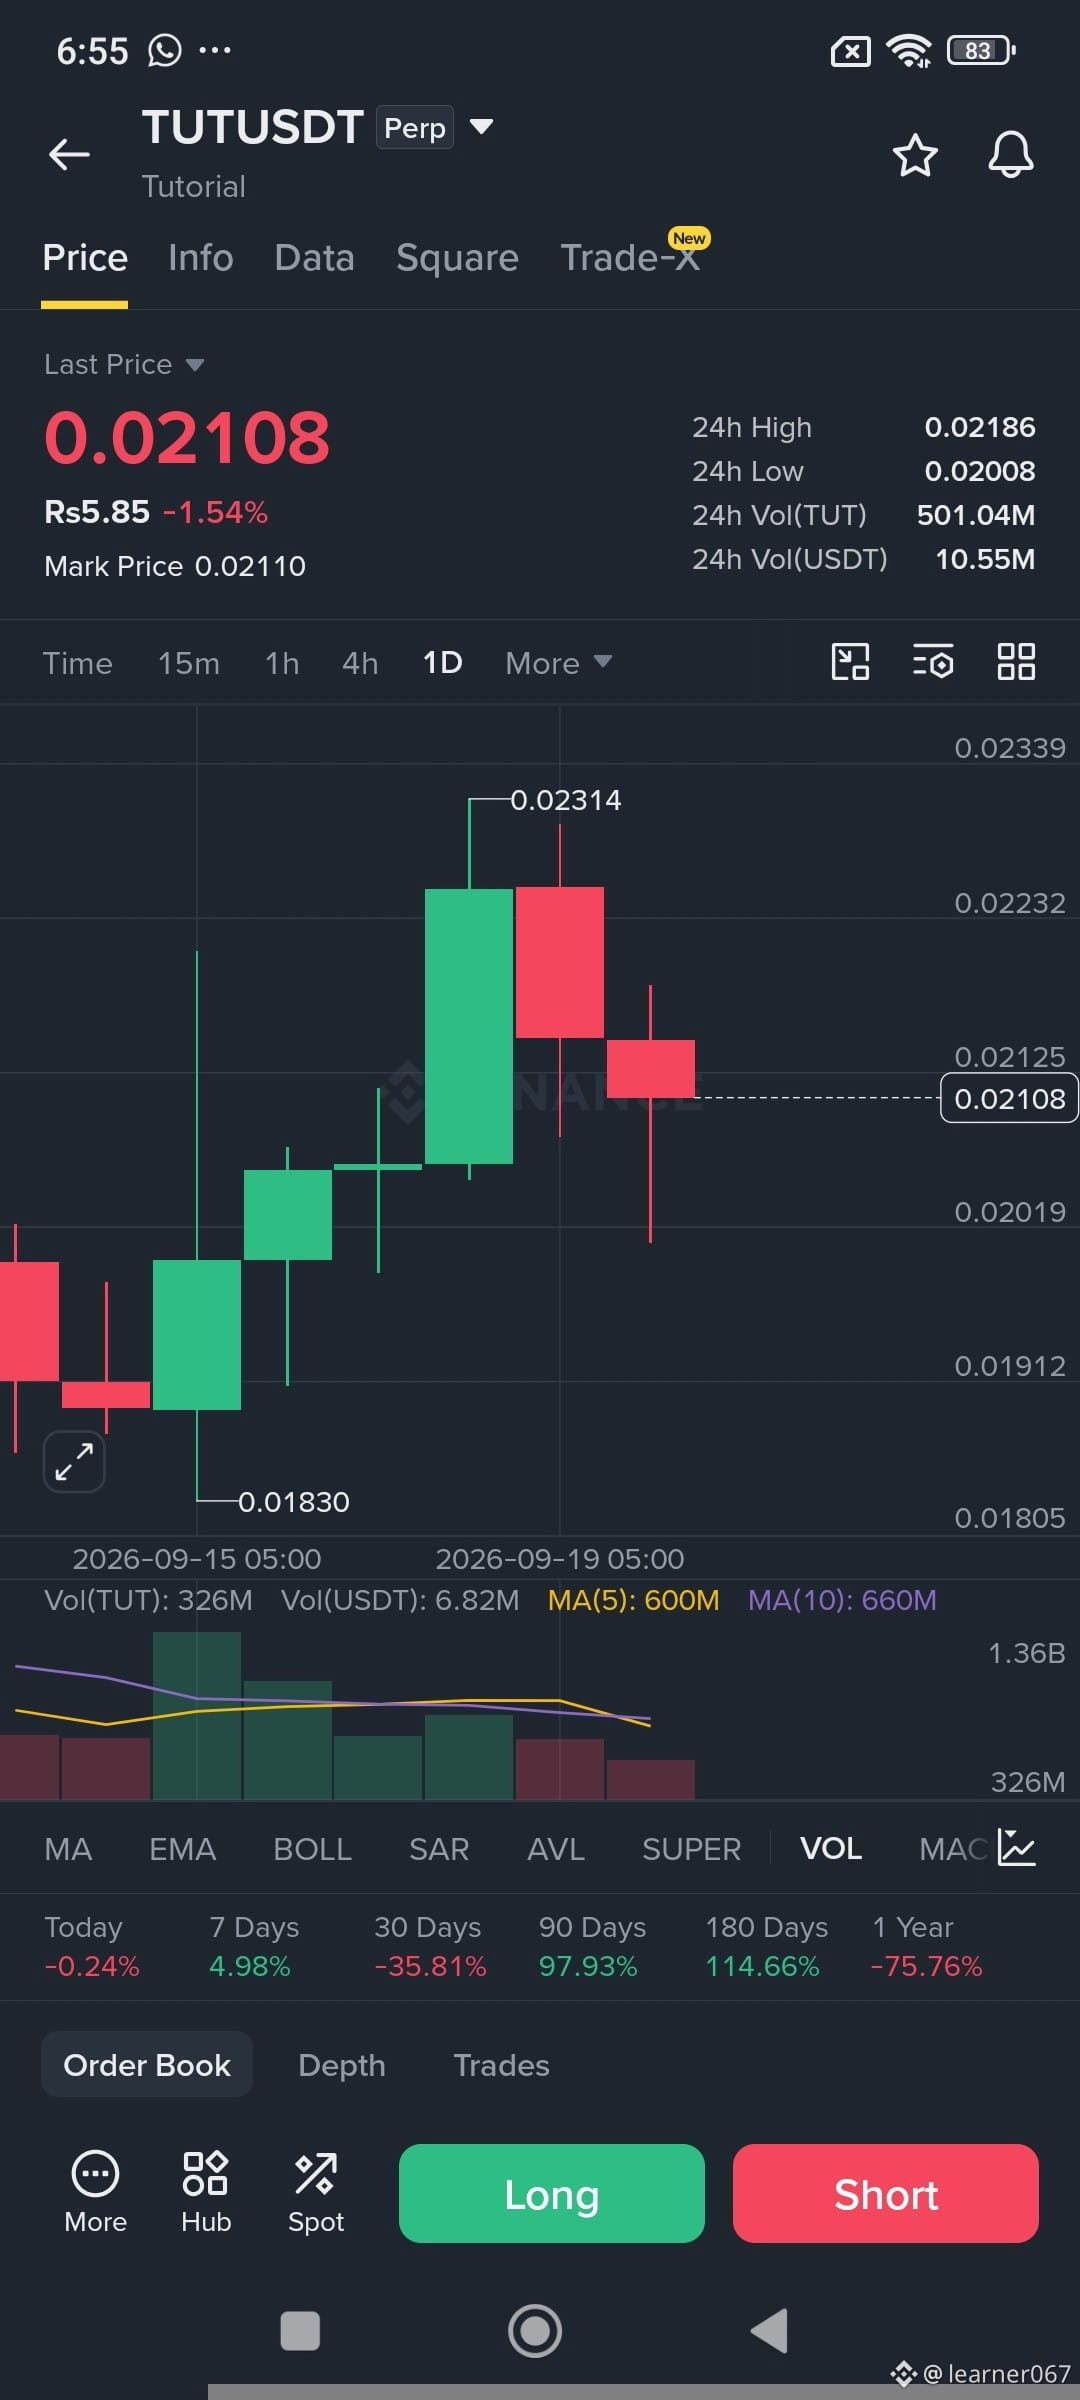
Looking at the chart, $TUT recently pushed up to a high of 0.02314 before facing some resistance. It’s currently cooling down around 0.02108, down slightly (-1.54%) over the last 24 hours.
👀Here’s what’s catching the eye right now:
👉Support holding: The price bounced nicely off the 0.01830 zone earlier, showing buyers are still active on dips.
👉Consolidation: After a strong green run, we’re seeing a red candle pull things back into a tight trading range between 0.02008 and 0.02186.
👉Volume: 24h volume sits at a solid 501.04M TUT, showing people are definitely keeping a close watch.
Are you holding for another test of that 0.023+ peak, or waiting for a cleaner entry lower down?
#TUTUSDT
Looking at the chart, $TUT recently pushed up to a high of 0.02314 before facing some resistance. It’s currently cooling down around 0.02108, down slightly (-1.54%) over the last 24 hours.
👀Here’s what’s catching the eye right now:
👉Support holding: The price bounced nicely off the 0.01830 zone earlier, showing buyers are still active on dips.
👉Consolidation: After a strong green run, we’re seeing a red candle pull things back into a tight trading range between 0.02008 and 0.02186.
👉Volume: 24h volume sits at a solid 501.04M TUT, showing people are definitely keeping a close watch.
Are you holding for another test of that 0.023+ peak, or waiting for a cleaner entry lower down?
#TUTUSDT