$ZAMA Clears the Ceiling, but the Retest Matters
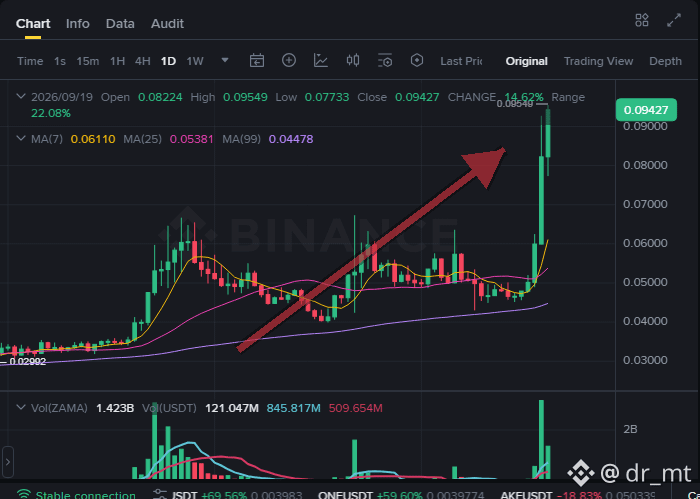
The move just pushed through the 15M resistance at 0.09336, with price pressing into the 0.09372 entry zone. The breakout itself is only 0.3856%, so this is not a huge distance above the level yet—but the participation is hard to ignore. Volume is running at 2.96x the recent average, and the sharp green expansion shows buyers are actually forcing price higher rather than drifting through resistance.
The chart shows a tight sideways base before the vertical push. That makes a pullback into 0.09336 a normal test, not an automatic warning. Holding that area would give the breakout more credibility. A quick rejection back under it, especially on fading volume, would suggest the move was mostly a spike.
The 4H picture adds some support to the bullish case: price has reclaimed the 0.09272 resistance area, while 0.04849 remains the major lower support. Still, the higher-timeframe move is extended after this burst, so chasing a large candle is where the risk increases.
Trade plan for $ZAMA:
Entry: 0.09372
TP1: 0.09720
TP2: 0.1007
TP3: 0.1042
SL: 0.09024
A clean hold above the breakout zone keeps the plan active. Losing 0.09024 means the setup has failed, so position size should stay reasonable. Taking some profit at TP1 can also reduce pressure if momentum cools after the initial surge.
Trade $ZAMA here with a plan, not panic.
#Crypto #Trading #Binance
DYOR
Follow me
dr_mt
The move just pushed through the 15M resistance at 0.09336, with price pressing into the 0.09372 entry zone. The breakout itself is only 0.3856%, so this is not a huge distance above the level yet—but the participation is hard to ignore. Volume is running at 2.96x the recent average, and the sharp green expansion shows buyers are actually forcing price higher rather than drifting through resistance.
The chart shows a tight sideways base before the vertical push. That makes a pullback into 0.09336 a normal test, not an automatic warning. Holding that area would give the breakout more credibility. A quick rejection back under it, especially on fading volume, would suggest the move was mostly a spike.
The 4H picture adds some support to the bullish case: price has reclaimed the 0.09272 resistance area, while 0.04849 remains the major lower support. Still, the higher-timeframe move is extended after this burst, so chasing a large candle is where the risk increases.
Trade plan for $ZAMA:
Entry: 0.09372
TP1: 0.09720
TP2: 0.1007
TP3: 0.1042
SL: 0.09024
A clean hold above the breakout zone keeps the plan active. Losing 0.09024 means the setup has failed, so position size should stay reasonable. Taking some profit at TP1 can also reduce pressure if momentum cools after the initial surge.
Trade $ZAMA here with a plan, not panic.
#Crypto #Trading #Binance
DYOR
Follow me
dr_mt