
🚀 $ICP /USDT Analysis: Is a Massive Breakout Loading?
$ICP is showing strong technical setups after a solid consolidation phase. Here is the full technical breakdown, key trading levels, and targets to watch. 👇
🔑 Key Technical Indicators
Moving Averages (EMA/SMA): ICP is holding firm above its key 20-day, 50-day, and 200-day moving averages. Trading above the 200 EMA signals a structural bullish trend reversal.
RSI (14): Currently sitting near ~65–70, reflecting strong buying momentum. While approaching high levels, it still leaves room for continuation before reaching extreme overbought territory.
MACD: Bullish crossover confirmed with positive momentum building on the histogram, indicating strong accumulation by buyers.
Volume: On-balance volume (OBV) and spot buying activity show early signs of organic accumulation rather than pure speculative pumping.
📊 Support & Resistance Levels
Immediate Resistance: $3.25 – $3.45 (0.5 to 0.618 Fib Extension Zone)
Major Breakout Level: $3.75 (Weekly high & 50 Weekly EMA hurdle)
Primary Support: $2.80 – $3.00 (20 EMA & local demand zone)
Macro Floor: $2.48 – $2.50
🎯 Trade Setup & Targets
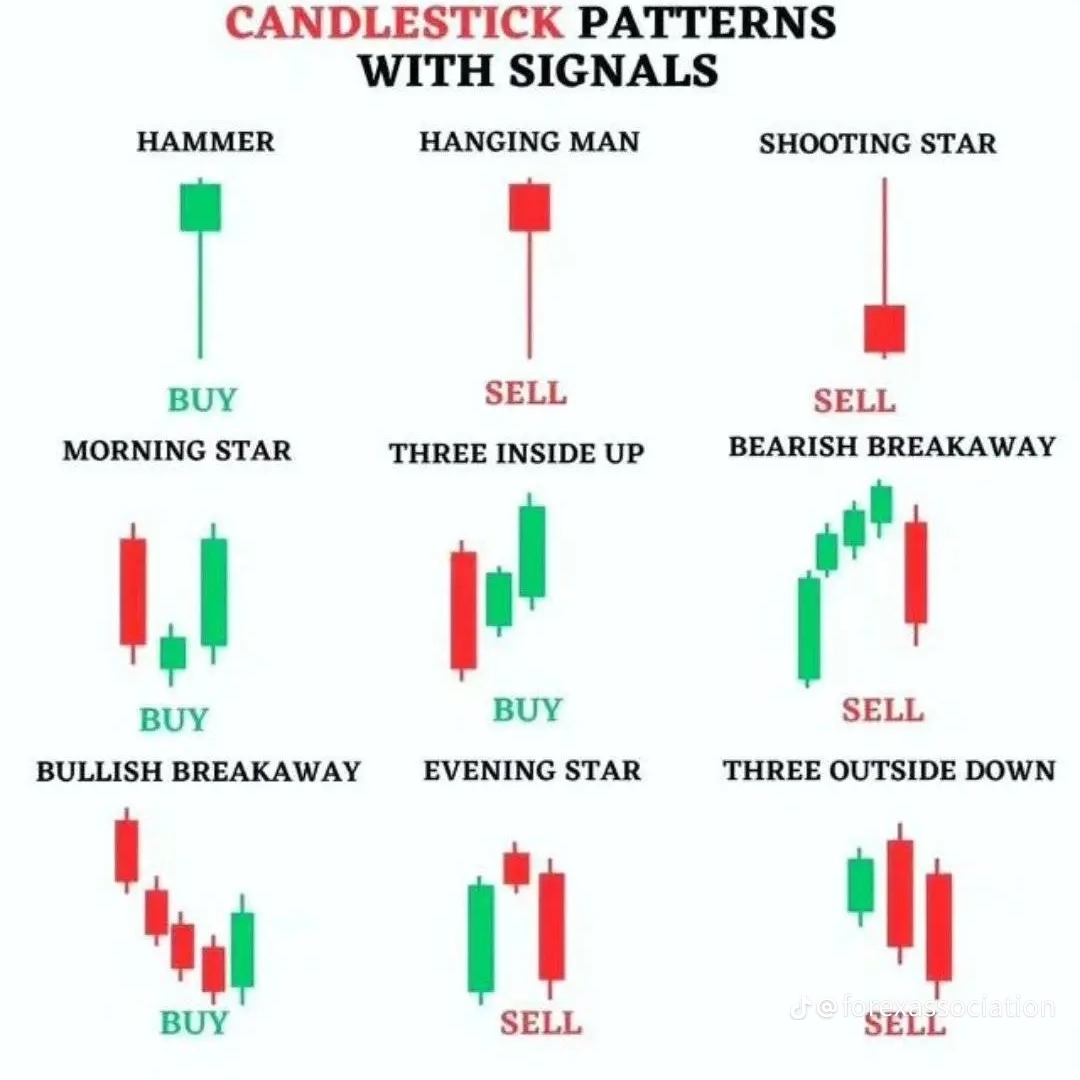
Bullish Scenario (Breakout Trigger): A clear daily candle close above $3.45 – $3.50 confirms momentum continuation toward higher resistance targets.
Target 1: $4.10
Target 2: $5.15
Extended Bullish Target: $6.80+
Bearish / Retest Scenario: If $ICP rejects at $3.25, look for a healthy retest toward $2.85 – $3.00 for a potential low-risk re-entry.
💡 Trading Strategy: Avoid chasing pumps at resistance. Wait for a retest of support or a confirmed high-volume close above major resistance before taking heavy positions. Always manage risk carefully!
What’s your price target for $ICP? Drop your thoughts below! 👇🔥
#icp #squarecreator #SquareBinance
$ICP is showing strong technical setups after a solid consolidation phase. Here is the full technical breakdown, key trading levels, and targets to watch. 👇
🔑 Key Technical Indicators
Moving Averages (EMA/SMA): ICP is holding firm above its key 20-day, 50-day, and 200-day moving averages. Trading above the 200 EMA signals a structural bullish trend reversal.
RSI (14): Currently sitting near ~65–70, reflecting strong buying momentum. While approaching high levels, it still leaves room for continuation before reaching extreme overbought territory.
MACD: Bullish crossover confirmed with positive momentum building on the histogram, indicating strong accumulation by buyers.
Volume: On-balance volume (OBV) and spot buying activity show early signs of organic accumulation rather than pure speculative pumping.
📊 Support & Resistance Levels
Immediate Resistance: $3.25 – $3.45 (0.5 to 0.618 Fib Extension Zone)
Major Breakout Level: $3.75 (Weekly high & 50 Weekly EMA hurdle)
Primary Support: $2.80 – $3.00 (20 EMA & local demand zone)
Macro Floor: $2.48 – $2.50
🎯 Trade Setup & Targets
Bullish Scenario (Breakout Trigger): A clear daily candle close above $3.45 – $3.50 confirms momentum continuation toward higher resistance targets.
Target 1: $4.10
Target 2: $5.15
Extended Bullish Target: $6.80+
Bearish / Retest Scenario: If $ICP rejects at $3.25, look for a healthy retest toward $2.85 – $3.00 for a potential low-risk re-entry.
💡 Trading Strategy: Avoid chasing pumps at resistance. Wait for a retest of support or a confirmed high-volume close above major resistance before taking heavy positions. Always manage risk carefully!
What’s your price target for $ICP? Drop your thoughts below! 👇🔥
#icp #squarecreator #SquareBinance