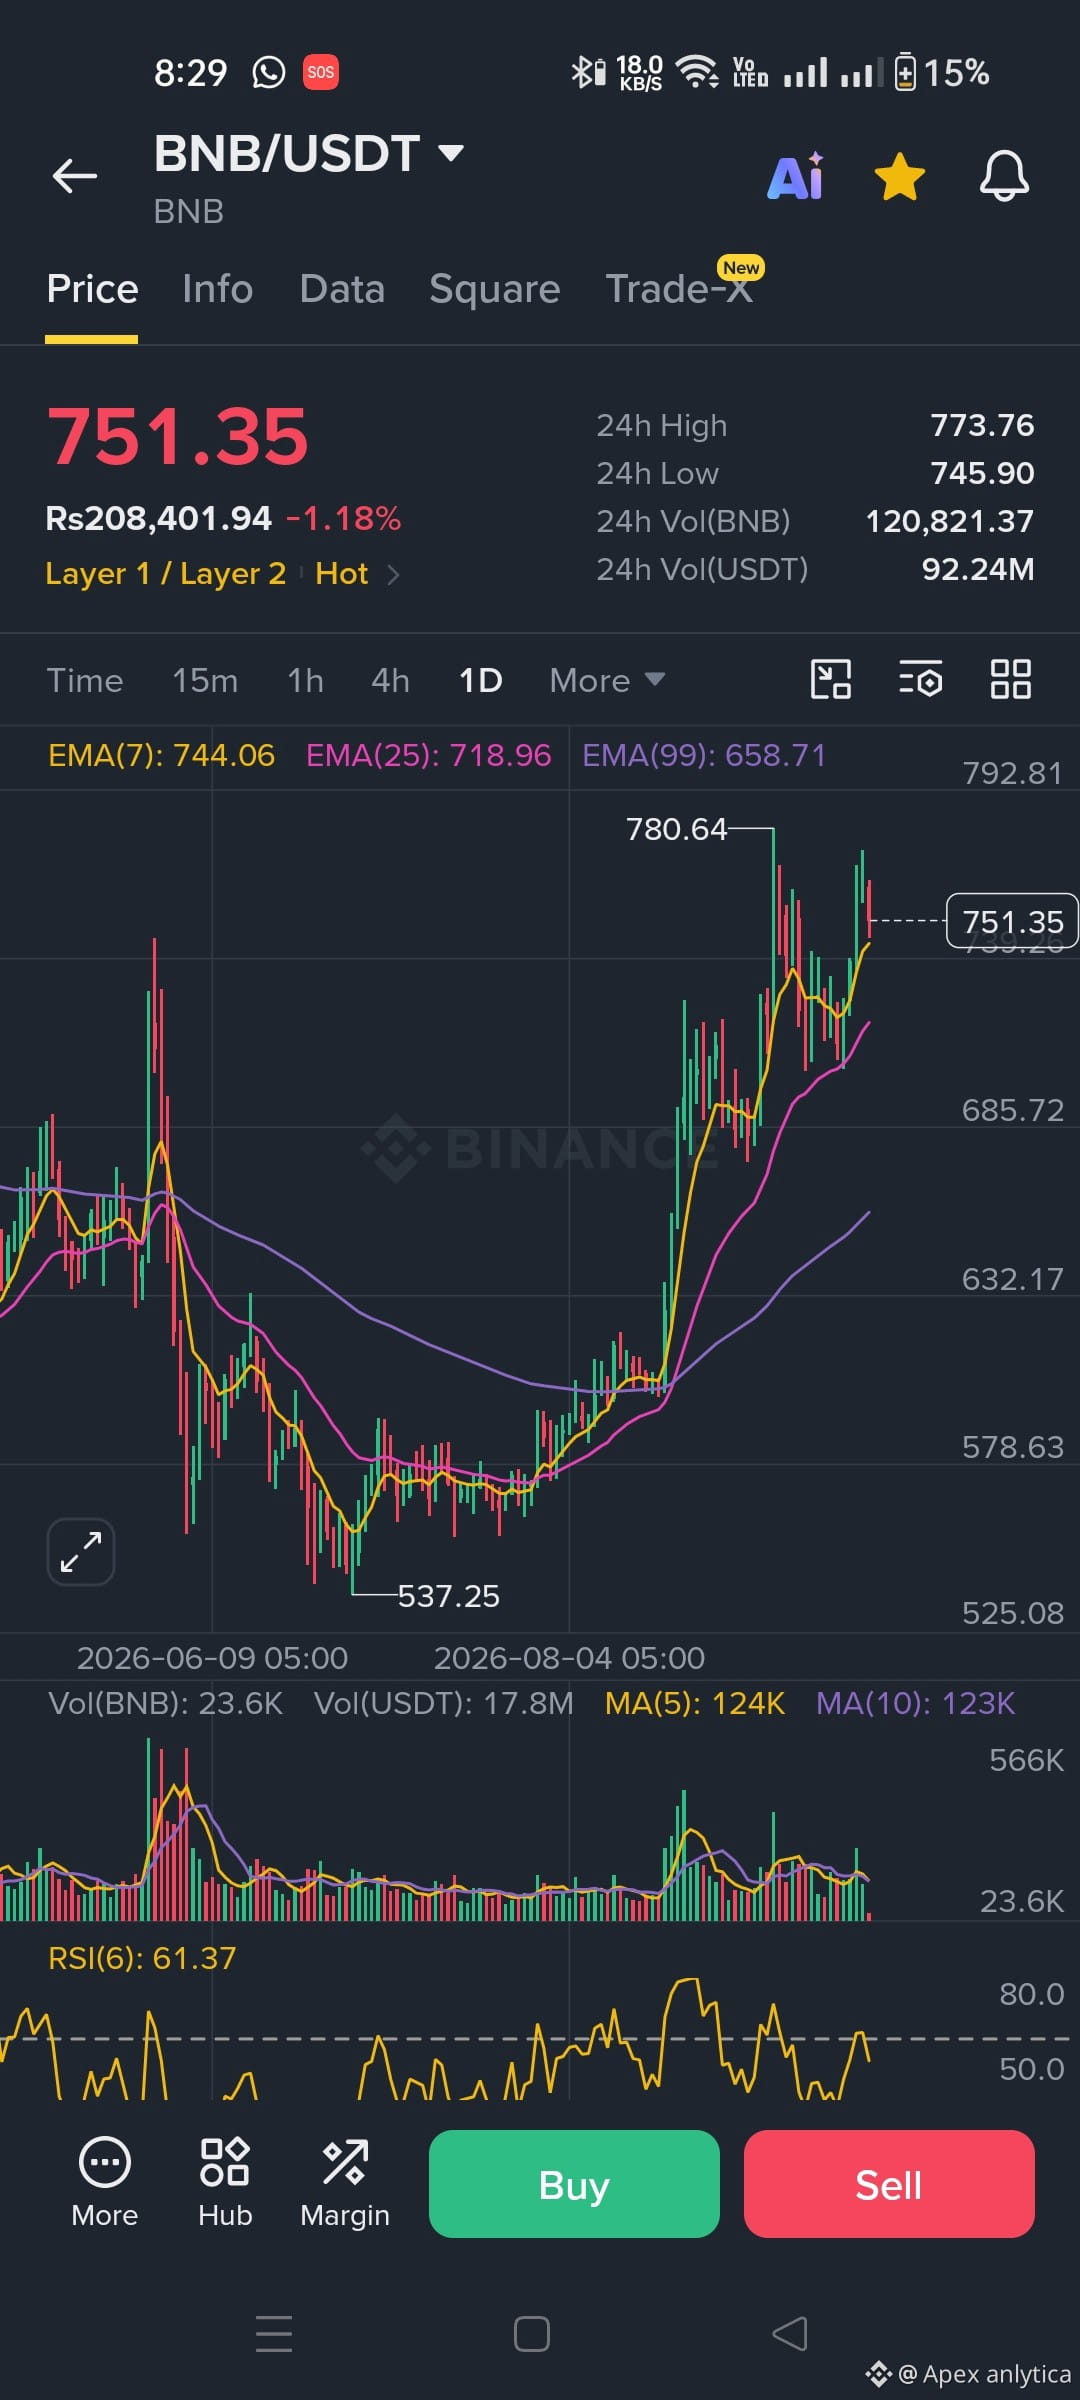
BNB/USDT Daily Chart Update 📊
Current Price: $751.35 (-1.18%)
24h Range: $745.90 – $773.76
Key Moving Averages (EMA):
EMA(7): 744.06
EMA(25): 718.96
EMA(99): 658.71
.71
RSI (6): 61.37
Quick Technical Outlook:
BNB is holding strong above key short-term moving averages on the daily timeframe, with the EMA(7) acting as immediate support near $744. The price recently tested a 24h high of $773.76 following a solid recovery from earlier lows, while the RSI sits comfortably in the neutral-to-bullish zone around 61.
Watch how price action interacts with current levels to see if consolidation will lead to a push back toward the recent $780 resistance zone.
#BNB #CryptoTrading #TechnicalAnalysis #BinanceSquare
Current Price: $751.35 (-1.18%)
24h Range: $745.90 – $773.76
Key Moving Averages (EMA):
EMA(7): 744.06
EMA(25): 718.96
EMA(99): 658.71
.71
RSI (6): 61.37
Quick Technical Outlook:
BNB is holding strong above key short-term moving averages on the daily timeframe, with the EMA(7) acting as immediate support near $744. The price recently tested a 24h high of $773.76 following a solid recovery from earlier lows, while the RSI sits comfortably in the neutral-to-bullish zone around 61.
Watch how price action interacts with current levels to see if consolidation will lead to a push back toward the recent $780 resistance zone.
#BNB #CryptoTrading #TechnicalAnalysis #BinanceSquare