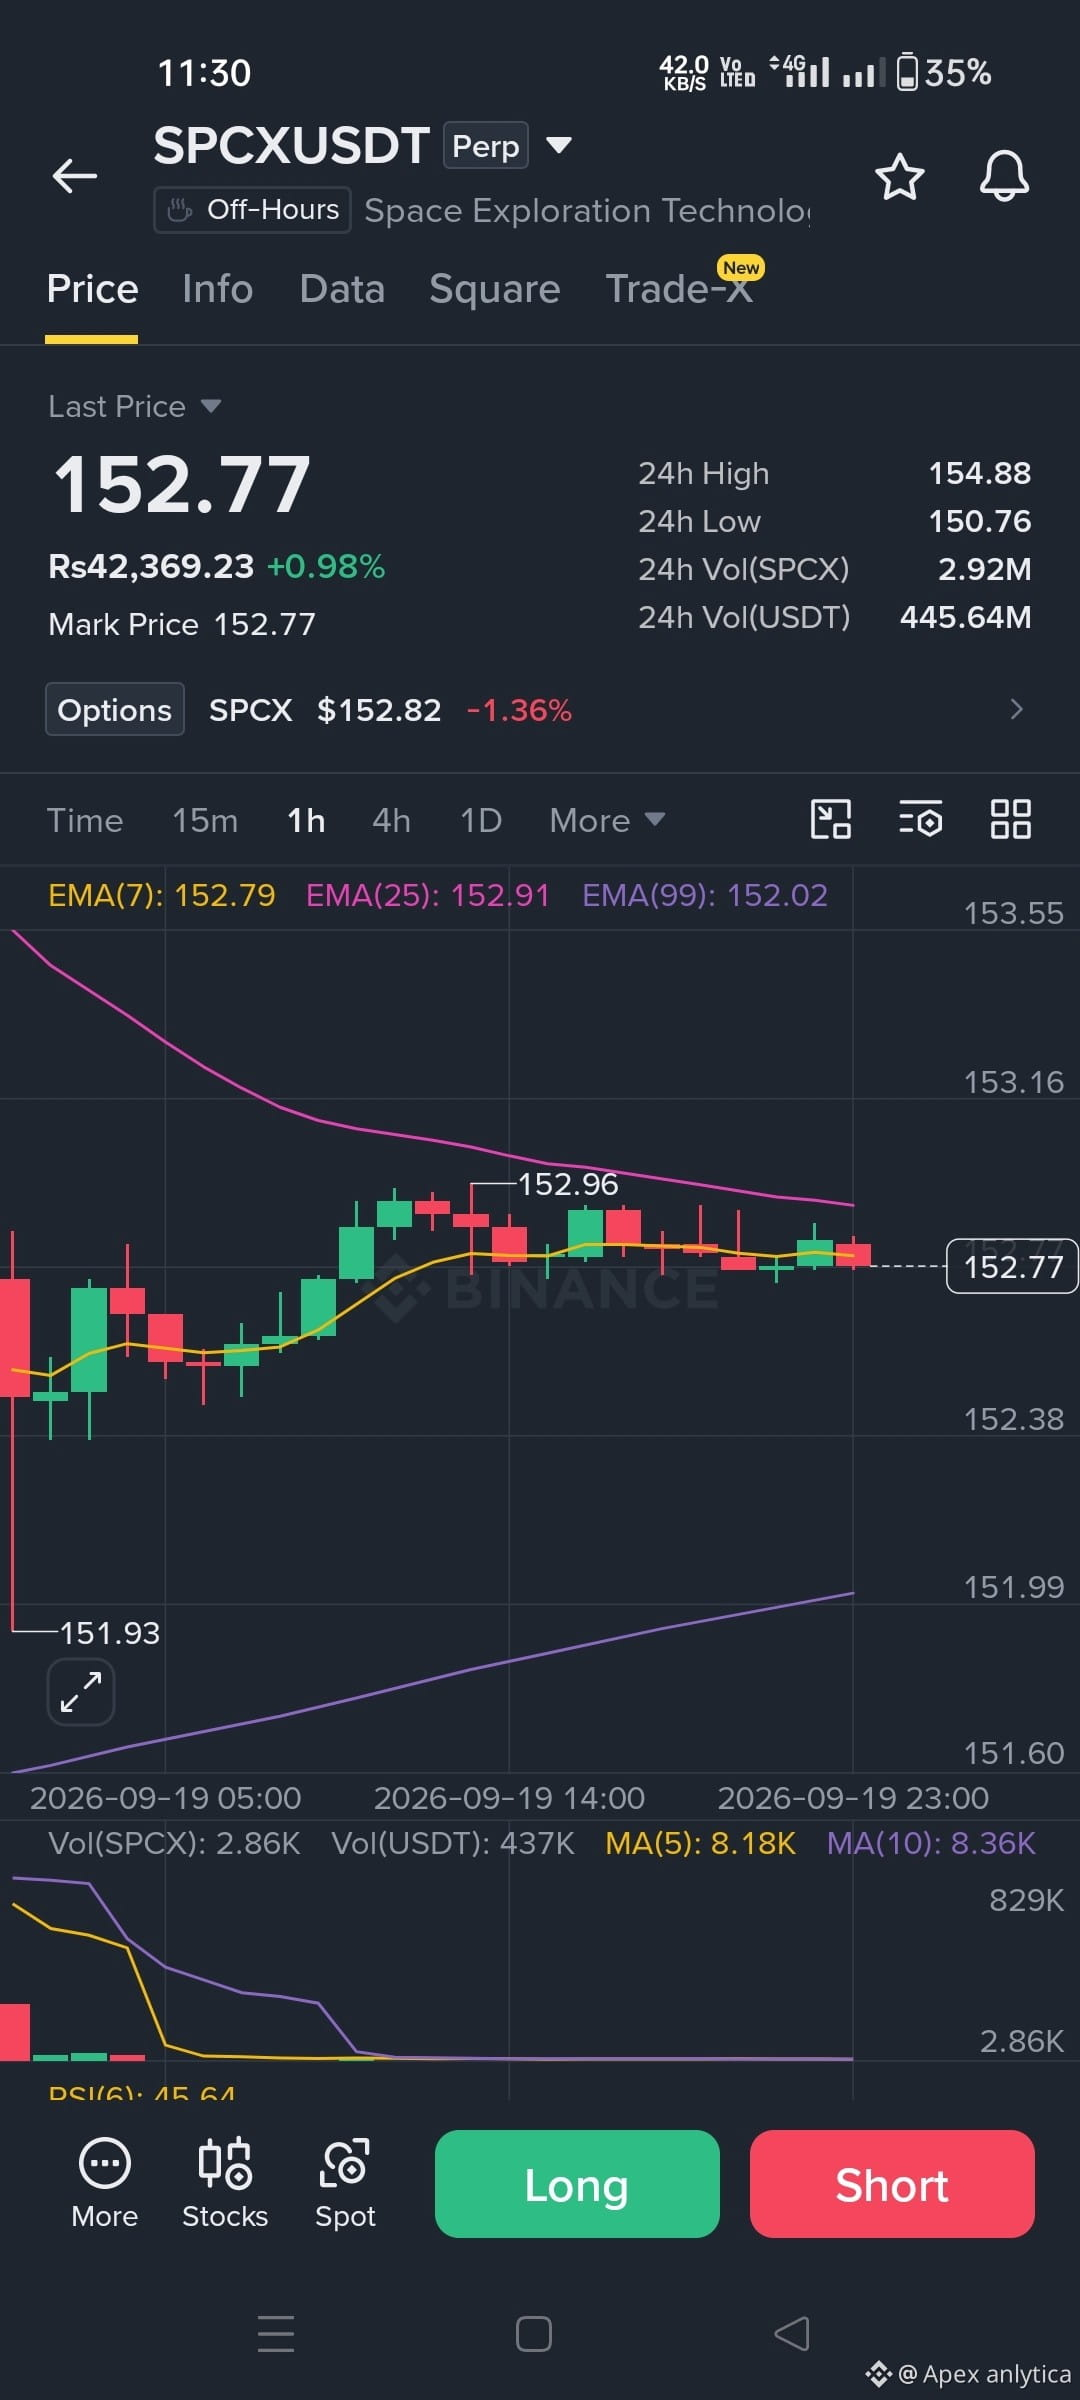
🚀 SPCX/USDT Technical Analysis: Consolidation vs. Trend Momentum!
Fellow Traders, let’s take a close look at the current price action and market structure for SPCX/USDT across the 1-hour and daily timeframes.
📊 Key Technical Levels & Indicators:
Current Price: 152.77 USDT
24h Range: 150.76 USDT (Low) – 154.88 USDT (High)
24h Volume: 2.92M SPCX / 445.64M USDT
1️⃣ 1-Hour Chart Outlook (Short-Term Trend):
Moving Averages: The price is consolidating tightly around the EMA lines, with EMA(7) at 152.79, EMA(25) at 152.91, and EMA(99) at 152.02. This tight convergence indicates a squeeze phase where a breakout could be imminent.
Support & Resistance: Immediate overhead resistance is marked near the 152.96–153.50 zone, while strong structural support sits down toward the ascending trendline around 151.93.
2️⃣ Daily Chart Outlook (Macro Structure):
Trend & MAs: On the daily timeframe, the macro trend remains resilient above key moving averages, with EMA(25) at 147.06 and EMA(99) at 151.06.
Recent Action: After printing a local high near 156.91, the price has experienced healthy retracement and consolidation, holding strong above the daily EMA support levels
Fellow Traders, let’s take a close look at the current price action and market structure for SPCX/USDT across the 1-hour and daily timeframes.
📊 Key Technical Levels & Indicators:
Current Price: 152.77 USDT
24h Range: 150.76 USDT (Low) – 154.88 USDT (High)
24h Volume: 2.92M SPCX / 445.64M USDT
1️⃣ 1-Hour Chart Outlook (Short-Term Trend):
Moving Averages: The price is consolidating tightly around the EMA lines, with EMA(7) at 152.79, EMA(25) at 152.91, and EMA(99) at 152.02. This tight convergence indicates a squeeze phase where a breakout could be imminent.
Support & Resistance: Immediate overhead resistance is marked near the 152.96–153.50 zone, while strong structural support sits down toward the ascending trendline around 151.93.
2️⃣ Daily Chart Outlook (Macro Structure):
Trend & MAs: On the daily timeframe, the macro trend remains resilient above key moving averages, with EMA(25) at 147.06 and EMA(99) at 151.06.
Recent Action: After printing a local high near 156.91, the price has experienced healthy retracement and consolidation, holding strong above the daily EMA support levels