DAILY SIGNAL — SOL/USDT
Date: 19 Sep 2026 Timeframe: 1m Intraday Bias: Bullish breakout → resistance test → continuation or pullback
📊 Market Bias
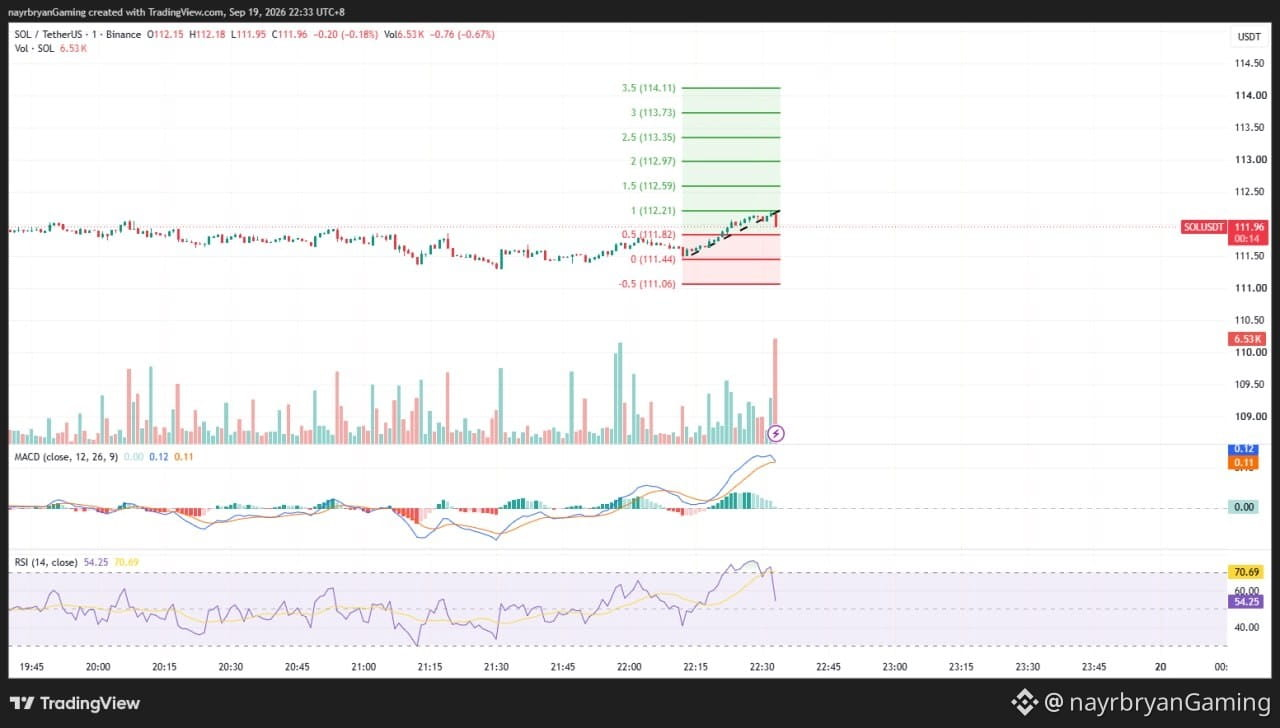
SOL has been recovering inside an ascending structure after consolidating around the 111.50–111.80 area.
Price pushed above the purple structure zone and is now testing the upper channel resistance near the 112.21 Fibonacci level.
The latest candle shows a pullback from that resistance, so confirmation is important before assuming another expansion.
🔹 Key Levels From Chart
Entry / Reaction Zone: 111.70 → 111.90
Key Resistance: 112.21
Invalidation: Below 111.45
Key Support: 111.45 → 111.70
🎯 Fibonacci Upside Targets
TP1 → 112.59 (1.5 Fib) TP2 → 112.97 (2.0 Fib) TP3 → 113.35 (2.5 Fib) TP4 → 113.73 (3.0 Fib) TP5 → 114.11 (3.5 Fib)
📉 Downside Reference
0.5 Fib → 111.83 0 Fib → 111.45 -0.5 Fib → 111.06
📈 Technical Breakdown
SOL broke upward from the prior consolidation structure and moved toward the upper boundary of the ascending channel.
Price is currently testing the 112.21 area, which also aligns with the upper trendline.
MACD remains positive, while RSI recently moved into the stronger momentum area before pulling back.
A sustained hold above the 111.70–111.90 reaction area would keep the upside structure relevant.
A loss of 111.45 would weaken the current bullish framework and shift attention toward the lower Fibonacci reference.
🧠 Quick Insight
“Breakouts need confirmation. A resistance test is not the same as a confirmed continuation.”
⚠️ Disclaimer
This is personal market analysis, not financial advice. This chart framework is for educational purposes only.
Always DYOR / DYODD, manage risk properly, and avoid emotional trading.
— @nayrbryanGaming #SOL #SOLUSDT #Crypto #Trading #TechnicalAnalysis #PriceAction #Fibonacci #Binance #DYOR #NFA #NoFOMO
Date: 19 Sep 2026 Timeframe: 1m Intraday Bias: Bullish breakout → resistance test → continuation or pullback
📊 Market Bias
SOL has been recovering inside an ascending structure after consolidating around the 111.50–111.80 area.
Price pushed above the purple structure zone and is now testing the upper channel resistance near the 112.21 Fibonacci level.
The latest candle shows a pullback from that resistance, so confirmation is important before assuming another expansion.
🔹 Key Levels From Chart
Entry / Reaction Zone: 111.70 → 111.90
Key Resistance: 112.21
Invalidation: Below 111.45
Key Support: 111.45 → 111.70
🎯 Fibonacci Upside Targets
TP1 → 112.59 (1.5 Fib) TP2 → 112.97 (2.0 Fib) TP3 → 113.35 (2.5 Fib) TP4 → 113.73 (3.0 Fib) TP5 → 114.11 (3.5 Fib)
📉 Downside Reference
0.5 Fib → 111.83 0 Fib → 111.45 -0.5 Fib → 111.06
📈 Technical Breakdown
SOL broke upward from the prior consolidation structure and moved toward the upper boundary of the ascending channel.
Price is currently testing the 112.21 area, which also aligns with the upper trendline.
MACD remains positive, while RSI recently moved into the stronger momentum area before pulling back.
A sustained hold above the 111.70–111.90 reaction area would keep the upside structure relevant.
A loss of 111.45 would weaken the current bullish framework and shift attention toward the lower Fibonacci reference.
🧠 Quick Insight
“Breakouts need confirmation. A resistance test is not the same as a confirmed continuation.”
⚠️ Disclaimer
This is personal market analysis, not financial advice. This chart framework is for educational purposes only.
Always DYOR / DYODD, manage risk properly, and avoid emotional trading.
— @nayrbryanGaming #SOL #SOLUSDT #Crypto #Trading #TechnicalAnalysis #PriceAction #Fibonacci #Binance #DYOR #NFA #NoFOMO