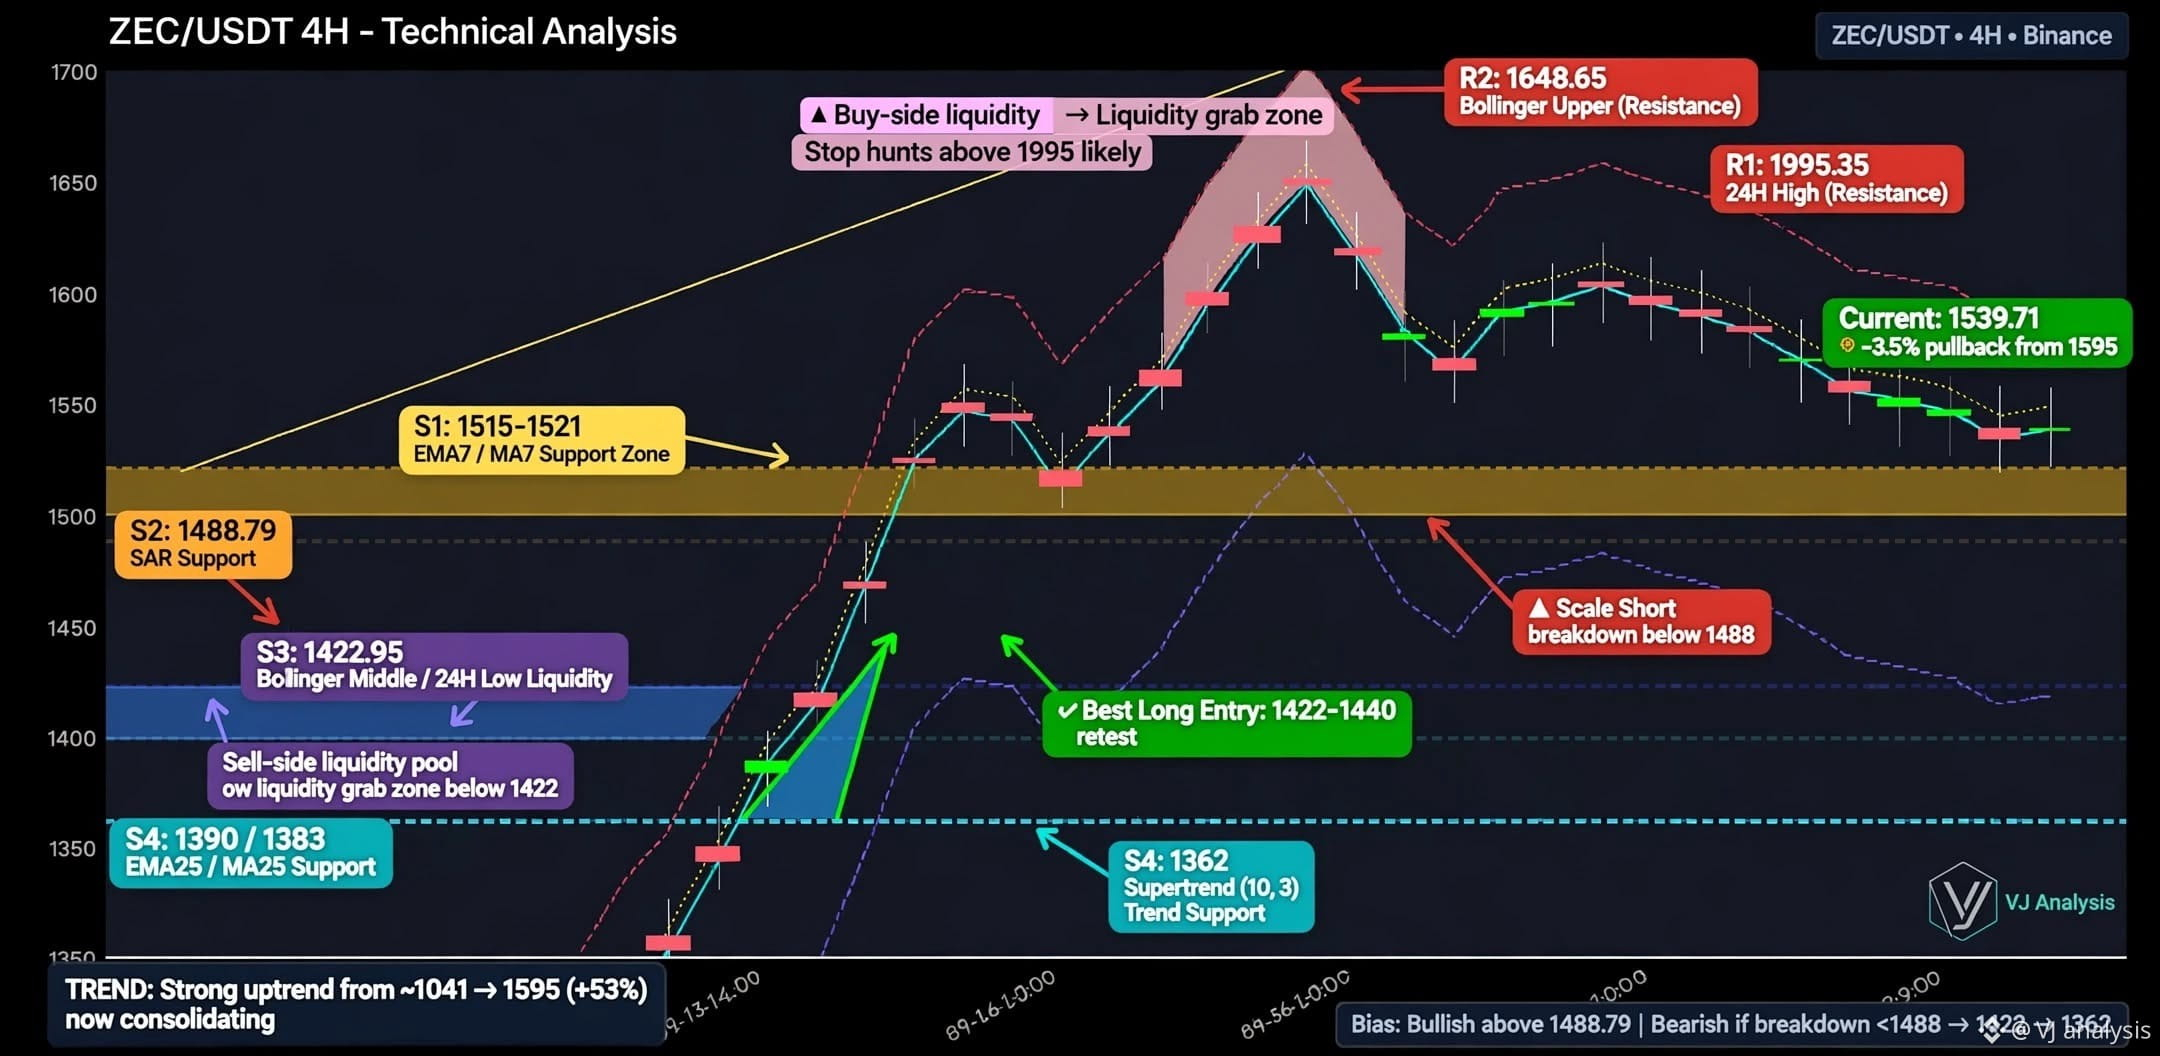
This is a clean 4H setup for #ZECUSDT - Binance. You caught the top perfectly. Here is the full breakdown of what's marked on your chart:
1. Structure & Trend
TREND: Strong uptrend from ∼1041 -> 1595 (+53%) now consolidating
Price made an impulsive rally, swept buy-side liquidity above 1595, then got rejected. Now it's in a sideways consolidation / bull flag just below the highs.
• Current: 1539.71 - showing -3.5% pullback from 1595 high • That pullback is healthy after a 53% move, not a reversal yet. 2. Key Levels on Chart
Resistance:
• R1: 1595.25 - 24H High (Resistance) - immediate ceiling • R2: 1648.85 - Bollinger Upper (Resistance) - marked as liquidity grab zone. The note says "Stop hunts above 1595 likely" - meaning wicks above R1 to grab stops before rejection.
Support Zones - layered:
• S1: 1515-1521 - EMA7 / MA7 Support Zone - first dynamic support, price is hovering just above it now • S2: 1488.79 - SAR Support - This is your line in the sand. Chart says: Bullish above 1488.79 • S3: 1422.95 - Bollinger Middle / 24H Low Liquidity - also marked as Sell-side liquidity pool. Note says "Liquidity grab zone below 1422" • S4: 1399 / 1383 - EMA25 / MA25 Support - deeper trend support • S4 (Supertrend): 1362 - Supertrend (10,3) Trend Support - final breakdown target. Chart says Bearish if breakdown <1438 -> 1422 -> 1362 3. Gameplan Marked on Chart • Best Long Entry: 1422-1440 reset - The chart is looking for a dip into the S3 zone to reset and go long again. That aligns with Bollinger Middle + sell-side liquidity sweep. • Scalp Short: breakdown below 1488 - If S2 breaks, momentum short toward 1422. • Buy-side liquidity = above 1595 (avoid chasing longs there) • Sell-side liquidity = below 1422 (where longs get attractive) 4. Bias Summary
Bias: Bullish above 1488.79 | Bearish if breakdown <1438 -> 1422 -> 1362
As long as 1488 holds, structure is consolidation in an uptrend. A daily close below 1488 invalidates the short-term bullish consolidation and opens the liquidity grab to 1422-1383.
1. Structure & Trend
TREND: Strong uptrend from ∼1041 -> 1595 (+53%) now consolidating
Price made an impulsive rally, swept buy-side liquidity above 1595, then got rejected. Now it's in a sideways consolidation / bull flag just below the highs.
• Current: 1539.71 - showing -3.5% pullback from 1595 high • That pullback is healthy after a 53% move, not a reversal yet. 2. Key Levels on Chart
Resistance:
• R1: 1595.25 - 24H High (Resistance) - immediate ceiling • R2: 1648.85 - Bollinger Upper (Resistance) - marked as liquidity grab zone. The note says "Stop hunts above 1595 likely" - meaning wicks above R1 to grab stops before rejection.
Support Zones - layered:
• S1: 1515-1521 - EMA7 / MA7 Support Zone - first dynamic support, price is hovering just above it now • S2: 1488.79 - SAR Support - This is your line in the sand. Chart says: Bullish above 1488.79 • S3: 1422.95 - Bollinger Middle / 24H Low Liquidity - also marked as Sell-side liquidity pool. Note says "Liquidity grab zone below 1422" • S4: 1399 / 1383 - EMA25 / MA25 Support - deeper trend support • S4 (Supertrend): 1362 - Supertrend (10,3) Trend Support - final breakdown target. Chart says Bearish if breakdown <1438 -> 1422 -> 1362 3. Gameplan Marked on Chart • Best Long Entry: 1422-1440 reset - The chart is looking for a dip into the S3 zone to reset and go long again. That aligns with Bollinger Middle + sell-side liquidity sweep. • Scalp Short: breakdown below 1488 - If S2 breaks, momentum short toward 1422. • Buy-side liquidity = above 1595 (avoid chasing longs there) • Sell-side liquidity = below 1422 (where longs get attractive) 4. Bias Summary
Bias: Bullish above 1488.79 | Bearish if breakdown <1438 -> 1422 -> 1362
As long as 1488 holds, structure is consolidation in an uptrend. A daily close below 1488 invalidates the short-term bullish consolidation and opens the liquidity grab to 1422-1383.