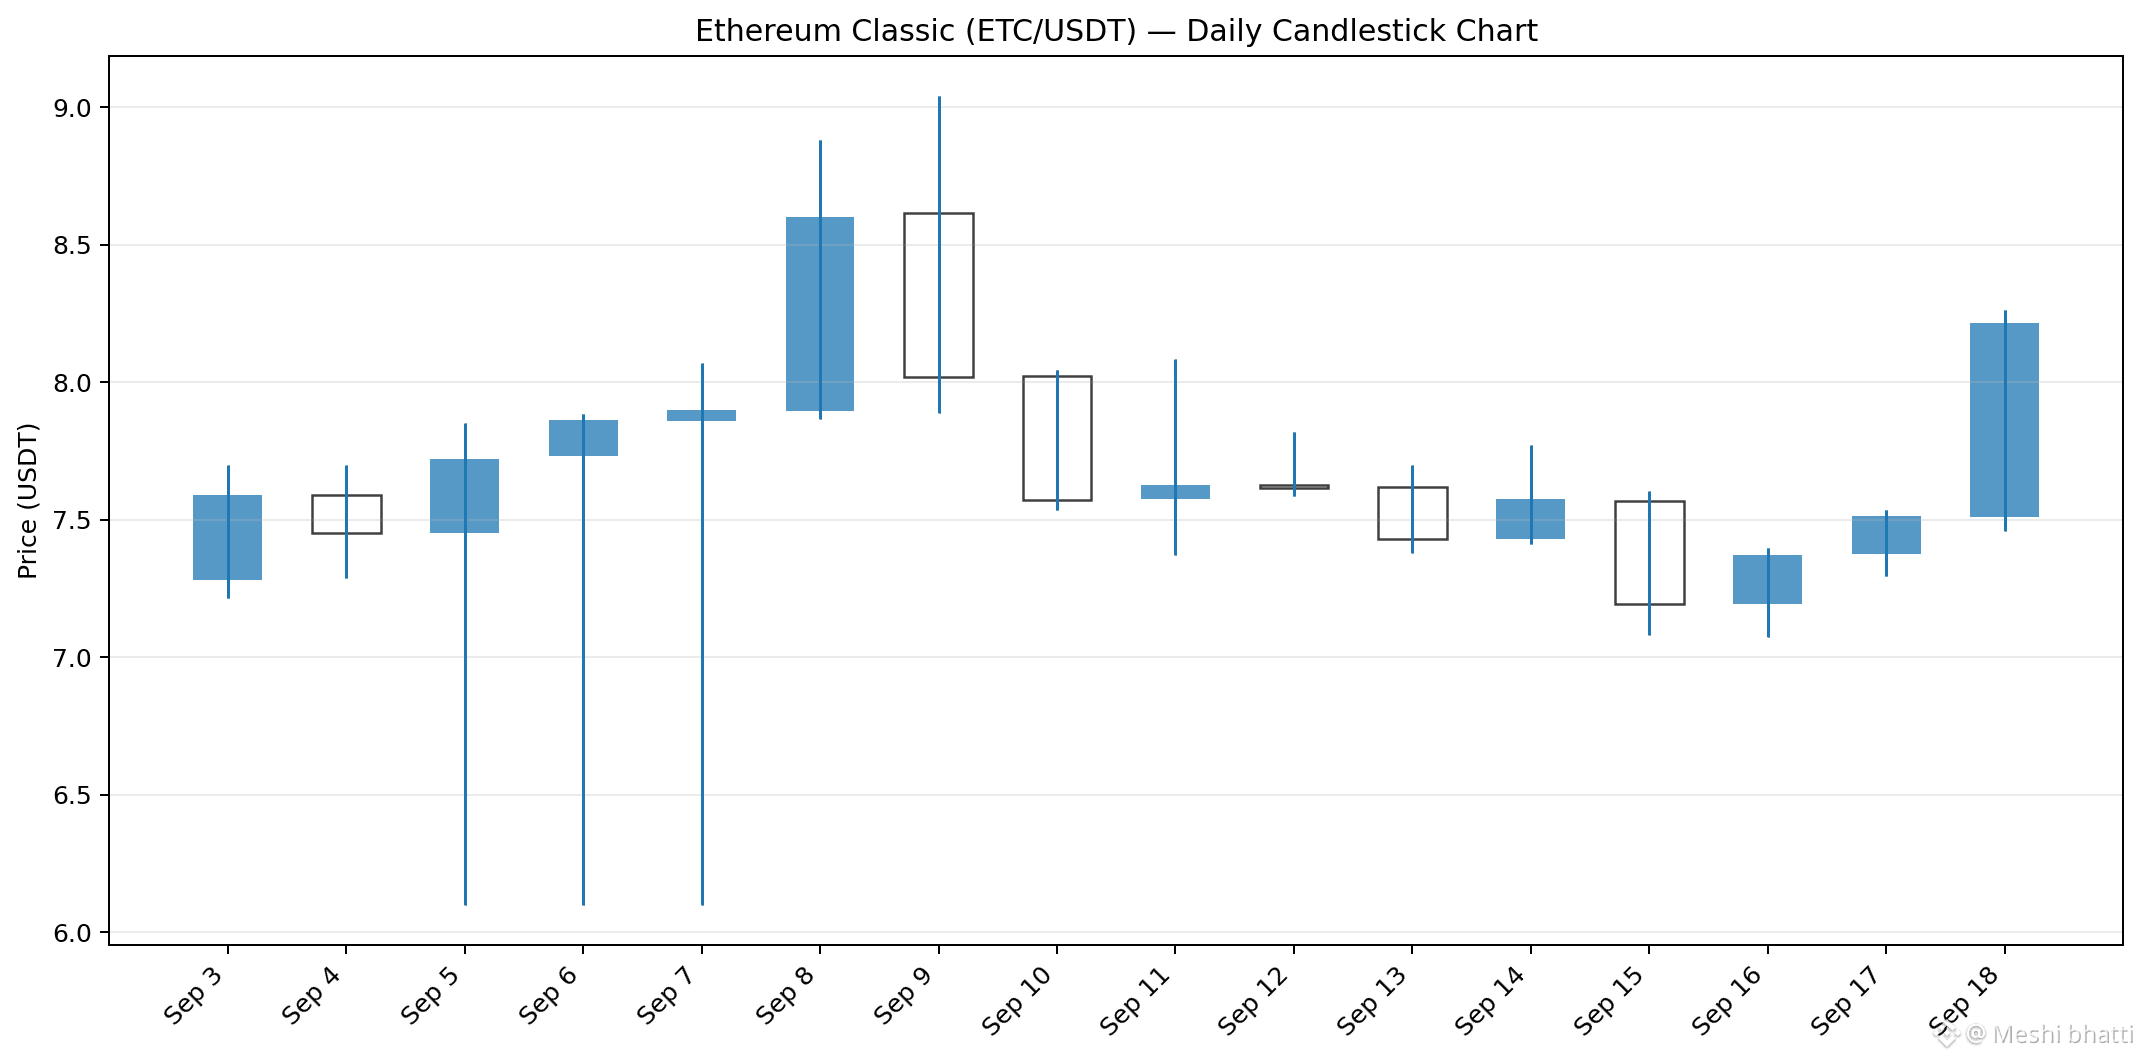
$ETC has shown increased volatility recently. On September 18, 2026, $ETC opened around $7.51, reached a high near $8.26, and closed around $8.21, according to recent daily OHLC data.
The recent price action shows a strong rebound from the $7.1–$7.5 area, with $ETC breaking back above $8 on September 18. However, the sharp moves during September also show significant volatility. Earlier in the month, ETC reached around $9.04 intraday, followed by a pullback toward the mid-$7 range.
Key levels to watch:
Support: roughly $7.1–$7.5 Near-term resistance: around $8.2–$8.6 Higher resistance: around $9.0 A sustained move above the recent resistance area would need confirmation from continued trading volume and price action
#BOJHikesRatesTo31YearHigh
#HYPEJumpsOver11%
The recent price action shows a strong rebound from the $7.1–$7.5 area, with $ETC breaking back above $8 on September 18. However, the sharp moves during September also show significant volatility. Earlier in the month, ETC reached around $9.04 intraday, followed by a pullback toward the mid-$7 range.
Key levels to watch:
Support: roughly $7.1–$7.5 Near-term resistance: around $8.2–$8.6 Higher resistance: around $9.0 A sustained move above the recent resistance area would need confirmation from continued trading volume and price action
#BOJHikesRatesTo31YearHigh
#HYPEJumpsOver11%