$FLORK — Market View
📊 Bias: NEUTRAL / WAIT
⏱️ Timeframe: 15M
💰 Current Price: $0.0082856
📈 Current Structure:
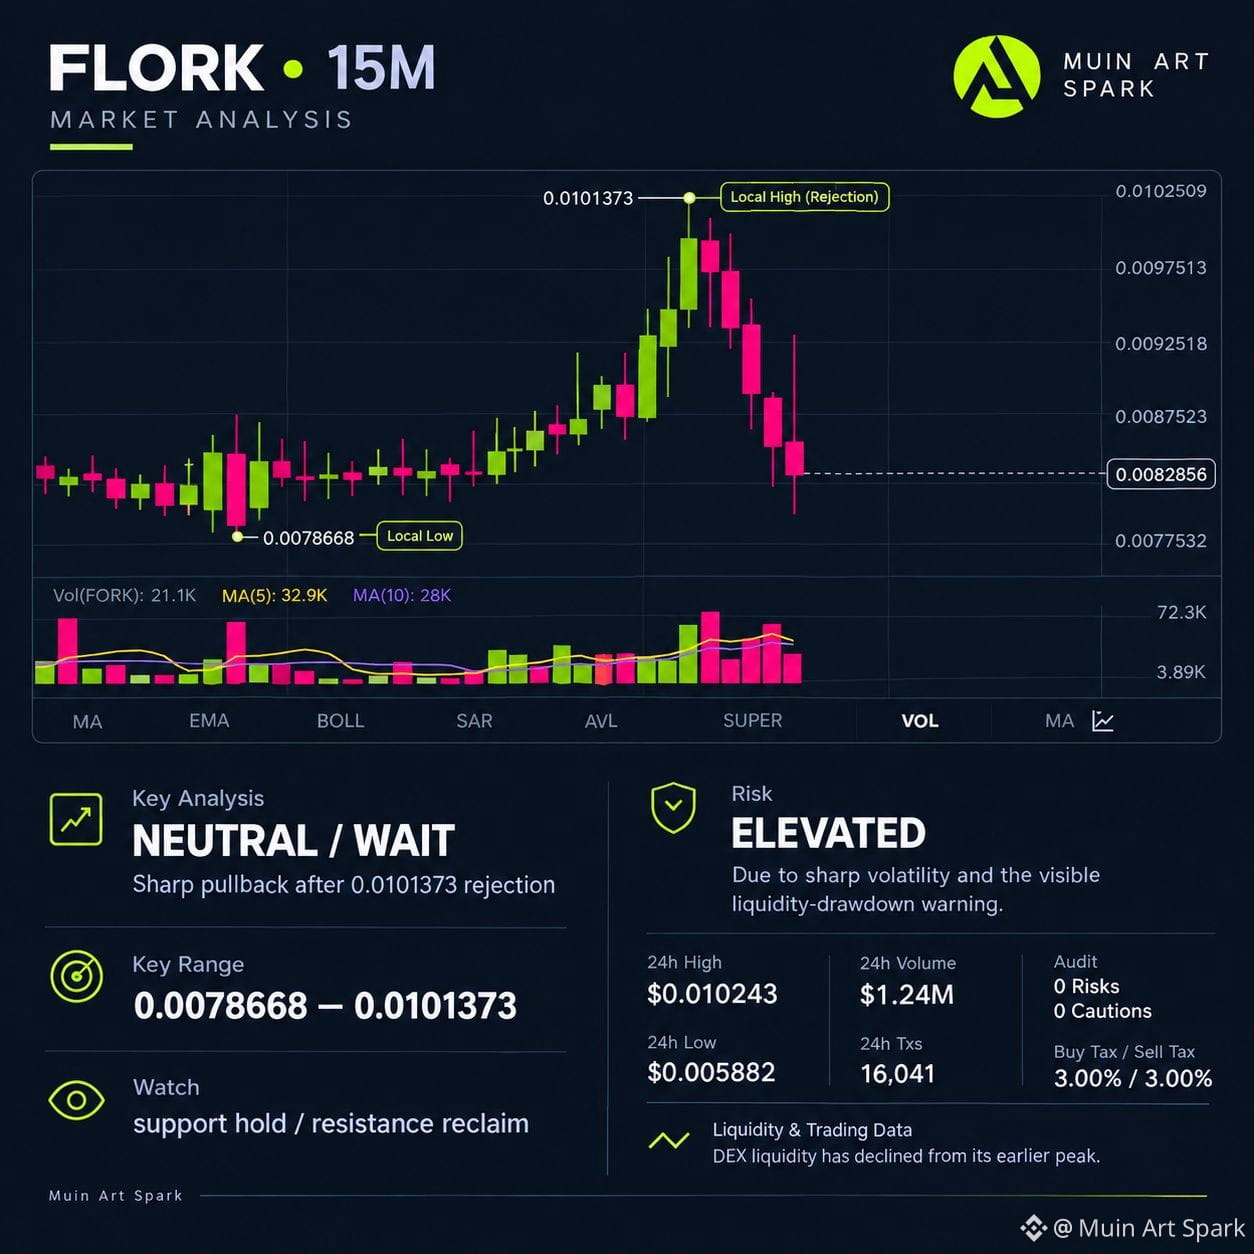
FLORK moved sharply higher from the visible $0.0078668 area and reached a local high of $0.0101373 before experiencing a strong pullback. Recent candles show selling pressure after the rejection, so the short-term structure is currently transitioning rather than clearly bullish.
🔑 Key Levels:
• Support: $0.0078668
• Resistance: $0.0101373
🎯 Near-Term Scenarios:
🟢 Bullish: A successful hold above support followed by a reclaim of the recent resistance area could strengthen the bullish case.
🔴 Bearish: Losing the $0.0078668 area could indicate further weakness and a deeper pullback.
🟡 Neutral: If price remains between these levels without clear confirmation, waiting may be preferable.
⚠️ Risk: ELEVATED
The chart shows sharp volatility, while the DYOR data also reports a 55.24% liquidity drawdown from its observed peak over the past 24 days.
🔍 Additional Data:
24H Volume: $1.24M
24H Transactions: 16,041
Audit: 0 Risks / 0 Cautions
Buy Tax / Sell Tax: 3% / 3%
🛑 Invalidation:
For the current neutral/wait thesis, a decisive break and sustained move beyond the visible range would change the short-term structure.
My view: The recent surge has been followed by a notable rejection and pullback. There is not enough confirmation from the screenshot to force a directional trade here. Watch how price reacts around $0.0078668 and whether buyers can reclaim the recent resistance area before considering a setup.
#FLORK #Crypto #Binance #TechnicalAnalysis #MarketAnalysis #DYOR
📊 Bias: NEUTRAL / WAIT
⏱️ Timeframe: 15M
💰 Current Price: $0.0082856
📈 Current Structure:
FLORK moved sharply higher from the visible $0.0078668 area and reached a local high of $0.0101373 before experiencing a strong pullback. Recent candles show selling pressure after the rejection, so the short-term structure is currently transitioning rather than clearly bullish.
🔑 Key Levels:
• Support: $0.0078668
• Resistance: $0.0101373
🎯 Near-Term Scenarios:
🟢 Bullish: A successful hold above support followed by a reclaim of the recent resistance area could strengthen the bullish case.
🔴 Bearish: Losing the $0.0078668 area could indicate further weakness and a deeper pullback.
🟡 Neutral: If price remains between these levels without clear confirmation, waiting may be preferable.
⚠️ Risk: ELEVATED
The chart shows sharp volatility, while the DYOR data also reports a 55.24% liquidity drawdown from its observed peak over the past 24 days.
🔍 Additional Data:
24H Volume: $1.24M
24H Transactions: 16,041
Audit: 0 Risks / 0 Cautions
Buy Tax / Sell Tax: 3% / 3%
🛑 Invalidation:
For the current neutral/wait thesis, a decisive break and sustained move beyond the visible range would change the short-term structure.
My view: The recent surge has been followed by a notable rejection and pullback. There is not enough confirmation from the screenshot to force a directional trade here. Watch how price reacts around $0.0078668 and whether buyers can reclaim the recent resistance area before considering a setup.
#FLORK #Crypto #Binance #TechnicalAnalysis #MarketAnalysis #DYOR