Is this the bottom, or is there still air underneath?
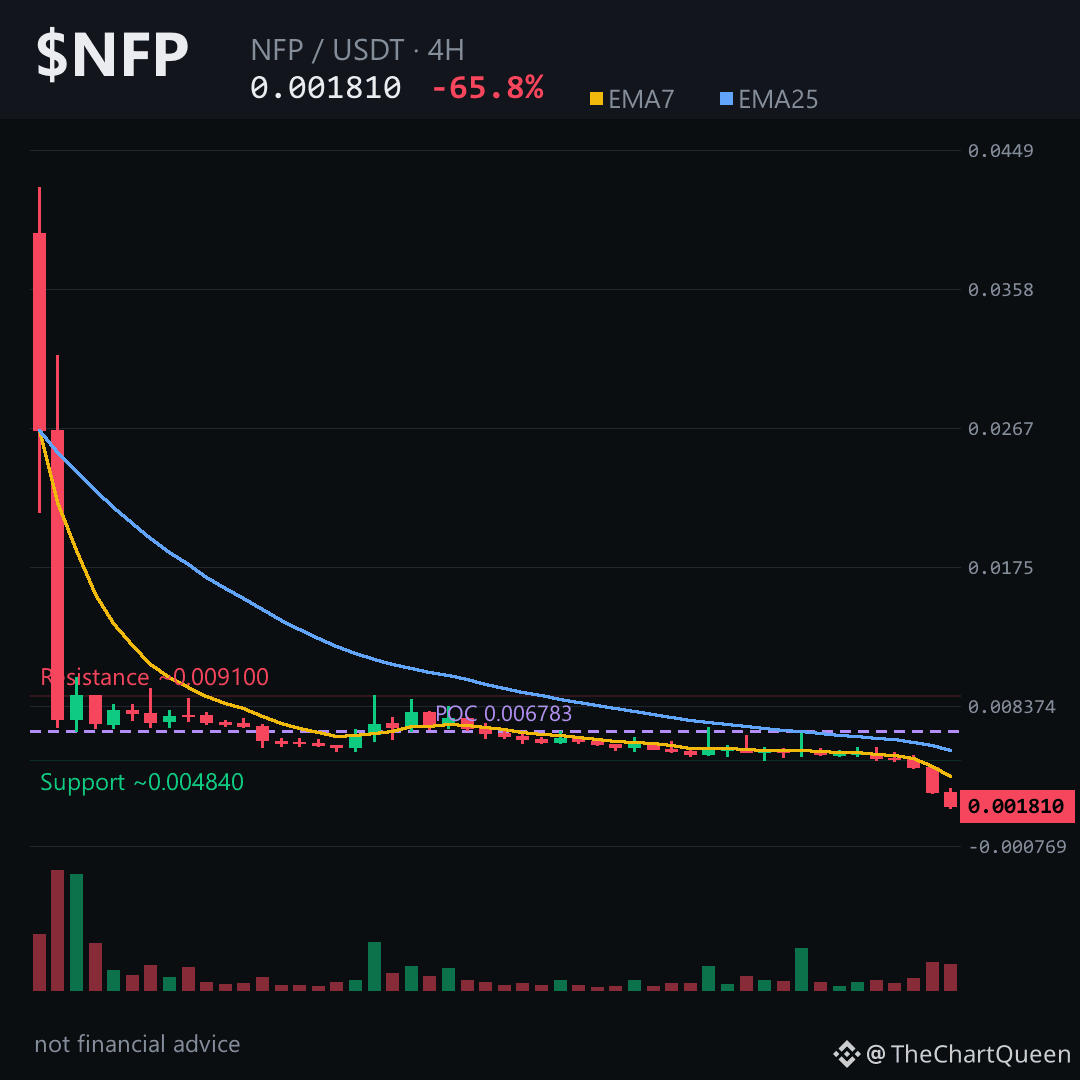
$NFP just printed a 65% single-day wipe — and the 4-hour chart shows the steepest two-candle drop in its recent history. A 37% candle followed by a 34% candle, back to back. That’s not normal selling pressure. That looks like a structural break.
Short-term moving averages are stacked bearish. RSI on the 4-hour sits near 12 — deeply oversold, which means a bounce is possible, but not that the downtrend is over. In strong breakdowns, oversold can stay oversold for a long time.
The key zone to watch is around 0.00191. That’s the invalidation line. If price can’t reclaim that area on a 4-hour close, the path of least resistance likely stays lower — toward 0.00165, and possibly beyond toward the macro objective near 0.00114.
The daily picture agrees: price is far below both the 7-day and 25-day averages, weekly RSI under 21. That’s deep, sustained distribution, not a normal pullback.
My read: the bounce, if it comes, is a gift of liquidity — not a trend change. The real risk isn’t missing a reversal. It’s catching a falling knife before the structure confirms.
Tap $NFP to pull up the chart and see these levels yourself.
What zone are you watching most closely on $NFP right now? 👇
⚠️ Not financial advice. DYOR.
#NFP #Crypto #BinanceSquare #Altcoins
$NFP just printed a 65% single-day wipe — and the 4-hour chart shows the steepest two-candle drop in its recent history. A 37% candle followed by a 34% candle, back to back. That’s not normal selling pressure. That looks like a structural break.
Short-term moving averages are stacked bearish. RSI on the 4-hour sits near 12 — deeply oversold, which means a bounce is possible, but not that the downtrend is over. In strong breakdowns, oversold can stay oversold for a long time.
The key zone to watch is around 0.00191. That’s the invalidation line. If price can’t reclaim that area on a 4-hour close, the path of least resistance likely stays lower — toward 0.00165, and possibly beyond toward the macro objective near 0.00114.
The daily picture agrees: price is far below both the 7-day and 25-day averages, weekly RSI under 21. That’s deep, sustained distribution, not a normal pullback.
My read: the bounce, if it comes, is a gift of liquidity — not a trend change. The real risk isn’t missing a reversal. It’s catching a falling knife before the structure confirms.
Tap $NFP to pull up the chart and see these levels yourself.
What zone are you watching most closely on $NFP right now? 👇
⚠️ Not financial advice. DYOR.
#NFP #Crypto #BinanceSquare #Altcoins