
$BTC /USDT — 15m Technical Update
Visible chart data only
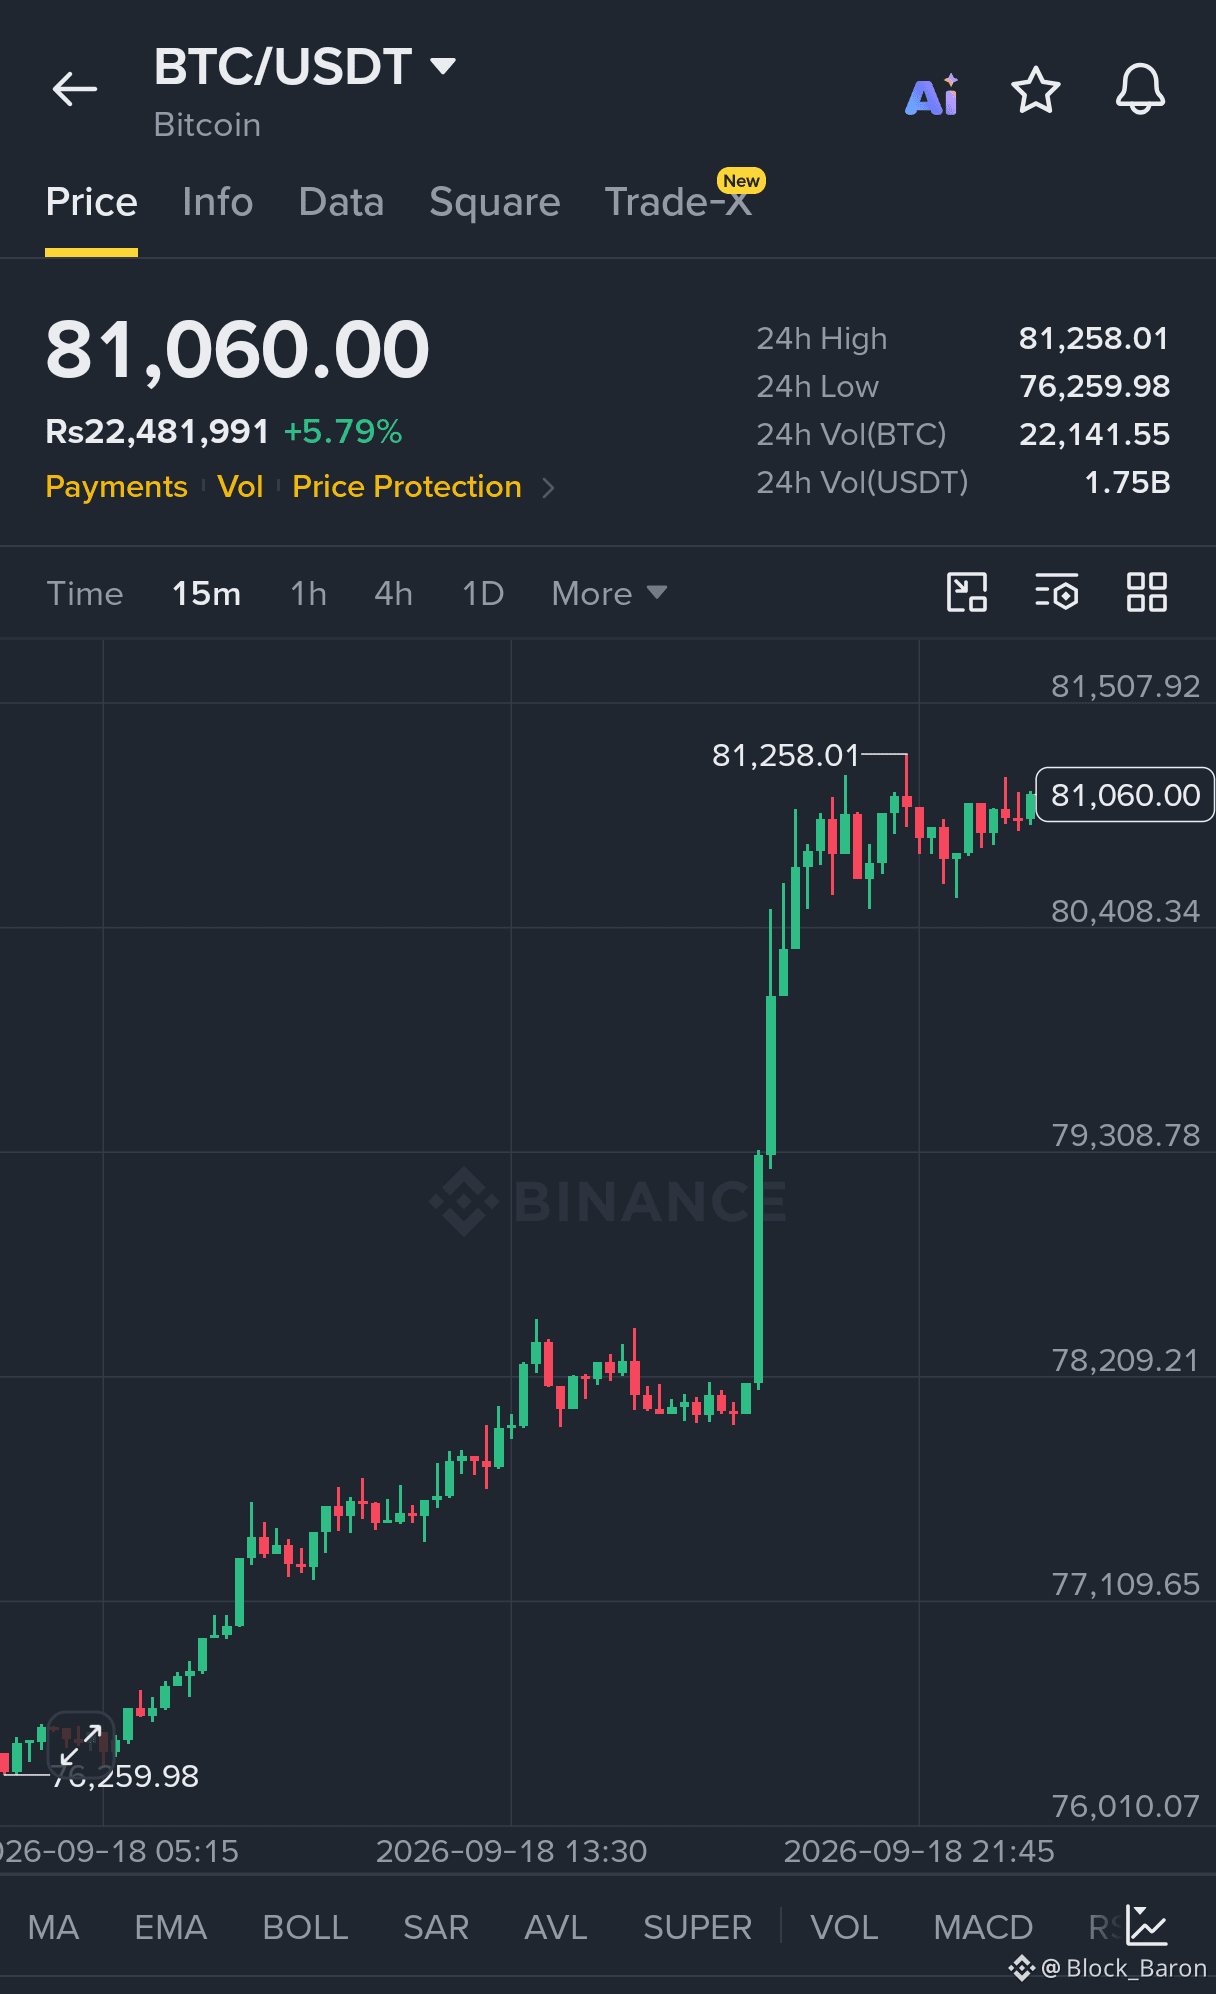
1. Current price: 81,060 USDT
2. Timeframe: 15m
3. Market structure: Bullish, currently consolidating near resistance
4. Major support: 80,408 / 79,309
5. Major resistance: 81,258 / 81,508
6. Recent breakout: Strong upside move from the 78,200 area toward 81,258
7. Candles/momentum: Strong impulse remains visible, but recent candles are smaller and mixed beneath 81,258 → momentum is pausing
8. Indicators/volume: Indicator names are visible, but their actual readings are not; no additional confirmation used.
📌 SIGNAL: NO TRADE — WAIT FOR CONFIRMATION
Bullish vs bearish check:
⬆️ Bullish: price remains well above the prior breakout area and is holding near the high.
⬇️ Bearish: repeated hesitation below 81,258 means rejection is still possible.
The chart does not show a confirmed break above 81,258.
Therefore, assigning an exact entry/SL/TP now would require guessing.
Bullish confirmation: 15m candle closes above 81,258 and holds/retests it.
Bearish confirmation: rejection followed by a decisive break below 80,408.
🔥 Confidence: High for WAIT, not for UP/DOWN direction.
Visible chart data only
1. Current price: 81,060 USDT
2. Timeframe: 15m
3. Market structure: Bullish, currently consolidating near resistance
4. Major support: 80,408 / 79,309
5. Major resistance: 81,258 / 81,508
6. Recent breakout: Strong upside move from the 78,200 area toward 81,258
7. Candles/momentum: Strong impulse remains visible, but recent candles are smaller and mixed beneath 81,258 → momentum is pausing
8. Indicators/volume: Indicator names are visible, but their actual readings are not; no additional confirmation used.
📌 SIGNAL: NO TRADE — WAIT FOR CONFIRMATION
Bullish vs bearish check:
⬆️ Bullish: price remains well above the prior breakout area and is holding near the high.
⬇️ Bearish: repeated hesitation below 81,258 means rejection is still possible.
The chart does not show a confirmed break above 81,258.
Therefore, assigning an exact entry/SL/TP now would require guessing.
Bullish confirmation: 15m candle closes above 81,258 and holds/retests it.
Bearish confirmation: rejection followed by a decisive break below 80,408.
🔥 Confidence: High for WAIT, not for UP/DOWN direction.